Confidence intervals and hypothesis testing
$\alpha$ confidence intervals
Hypothesis testing ($\alpha$ level)
Confidence intervals are most useful when you want to estimate population parameters
Hypothesis tests and p-values are most useful when you want to test hypotheses about population parameters
Confidence intervals give you a range of plausible values
p-values quantify the strength of evidence against the null hypothesis
Interval, test, or neither?
Are the following questions best assessed using:
- a hypothesis test?
- a confidence interval?
- or is statistical inference not relevant?
How much do college students sleep, on average?
Do college students sleep more than the recommended 8 hours a night, on average?
What proportion of college students in the sleep study sample slept at least 8 hours?
Pitfalls associated with formal hypothesis testing
Hypothesis testing is very powerful, as it helps shed light on whether an observed effect could be real or just due to random chance.
However, statistical significance is not foolproof, and it is possible to make the wrong decision, rejecting a true null hypothesis or not rejecting a false null hypothesis.
We will discuss common pitfalls associated with formal hypothesis testing, along with factors that influence the chances of these errors occurring.
Question of the day
offspring fitness (in fruit flies)?

Original study
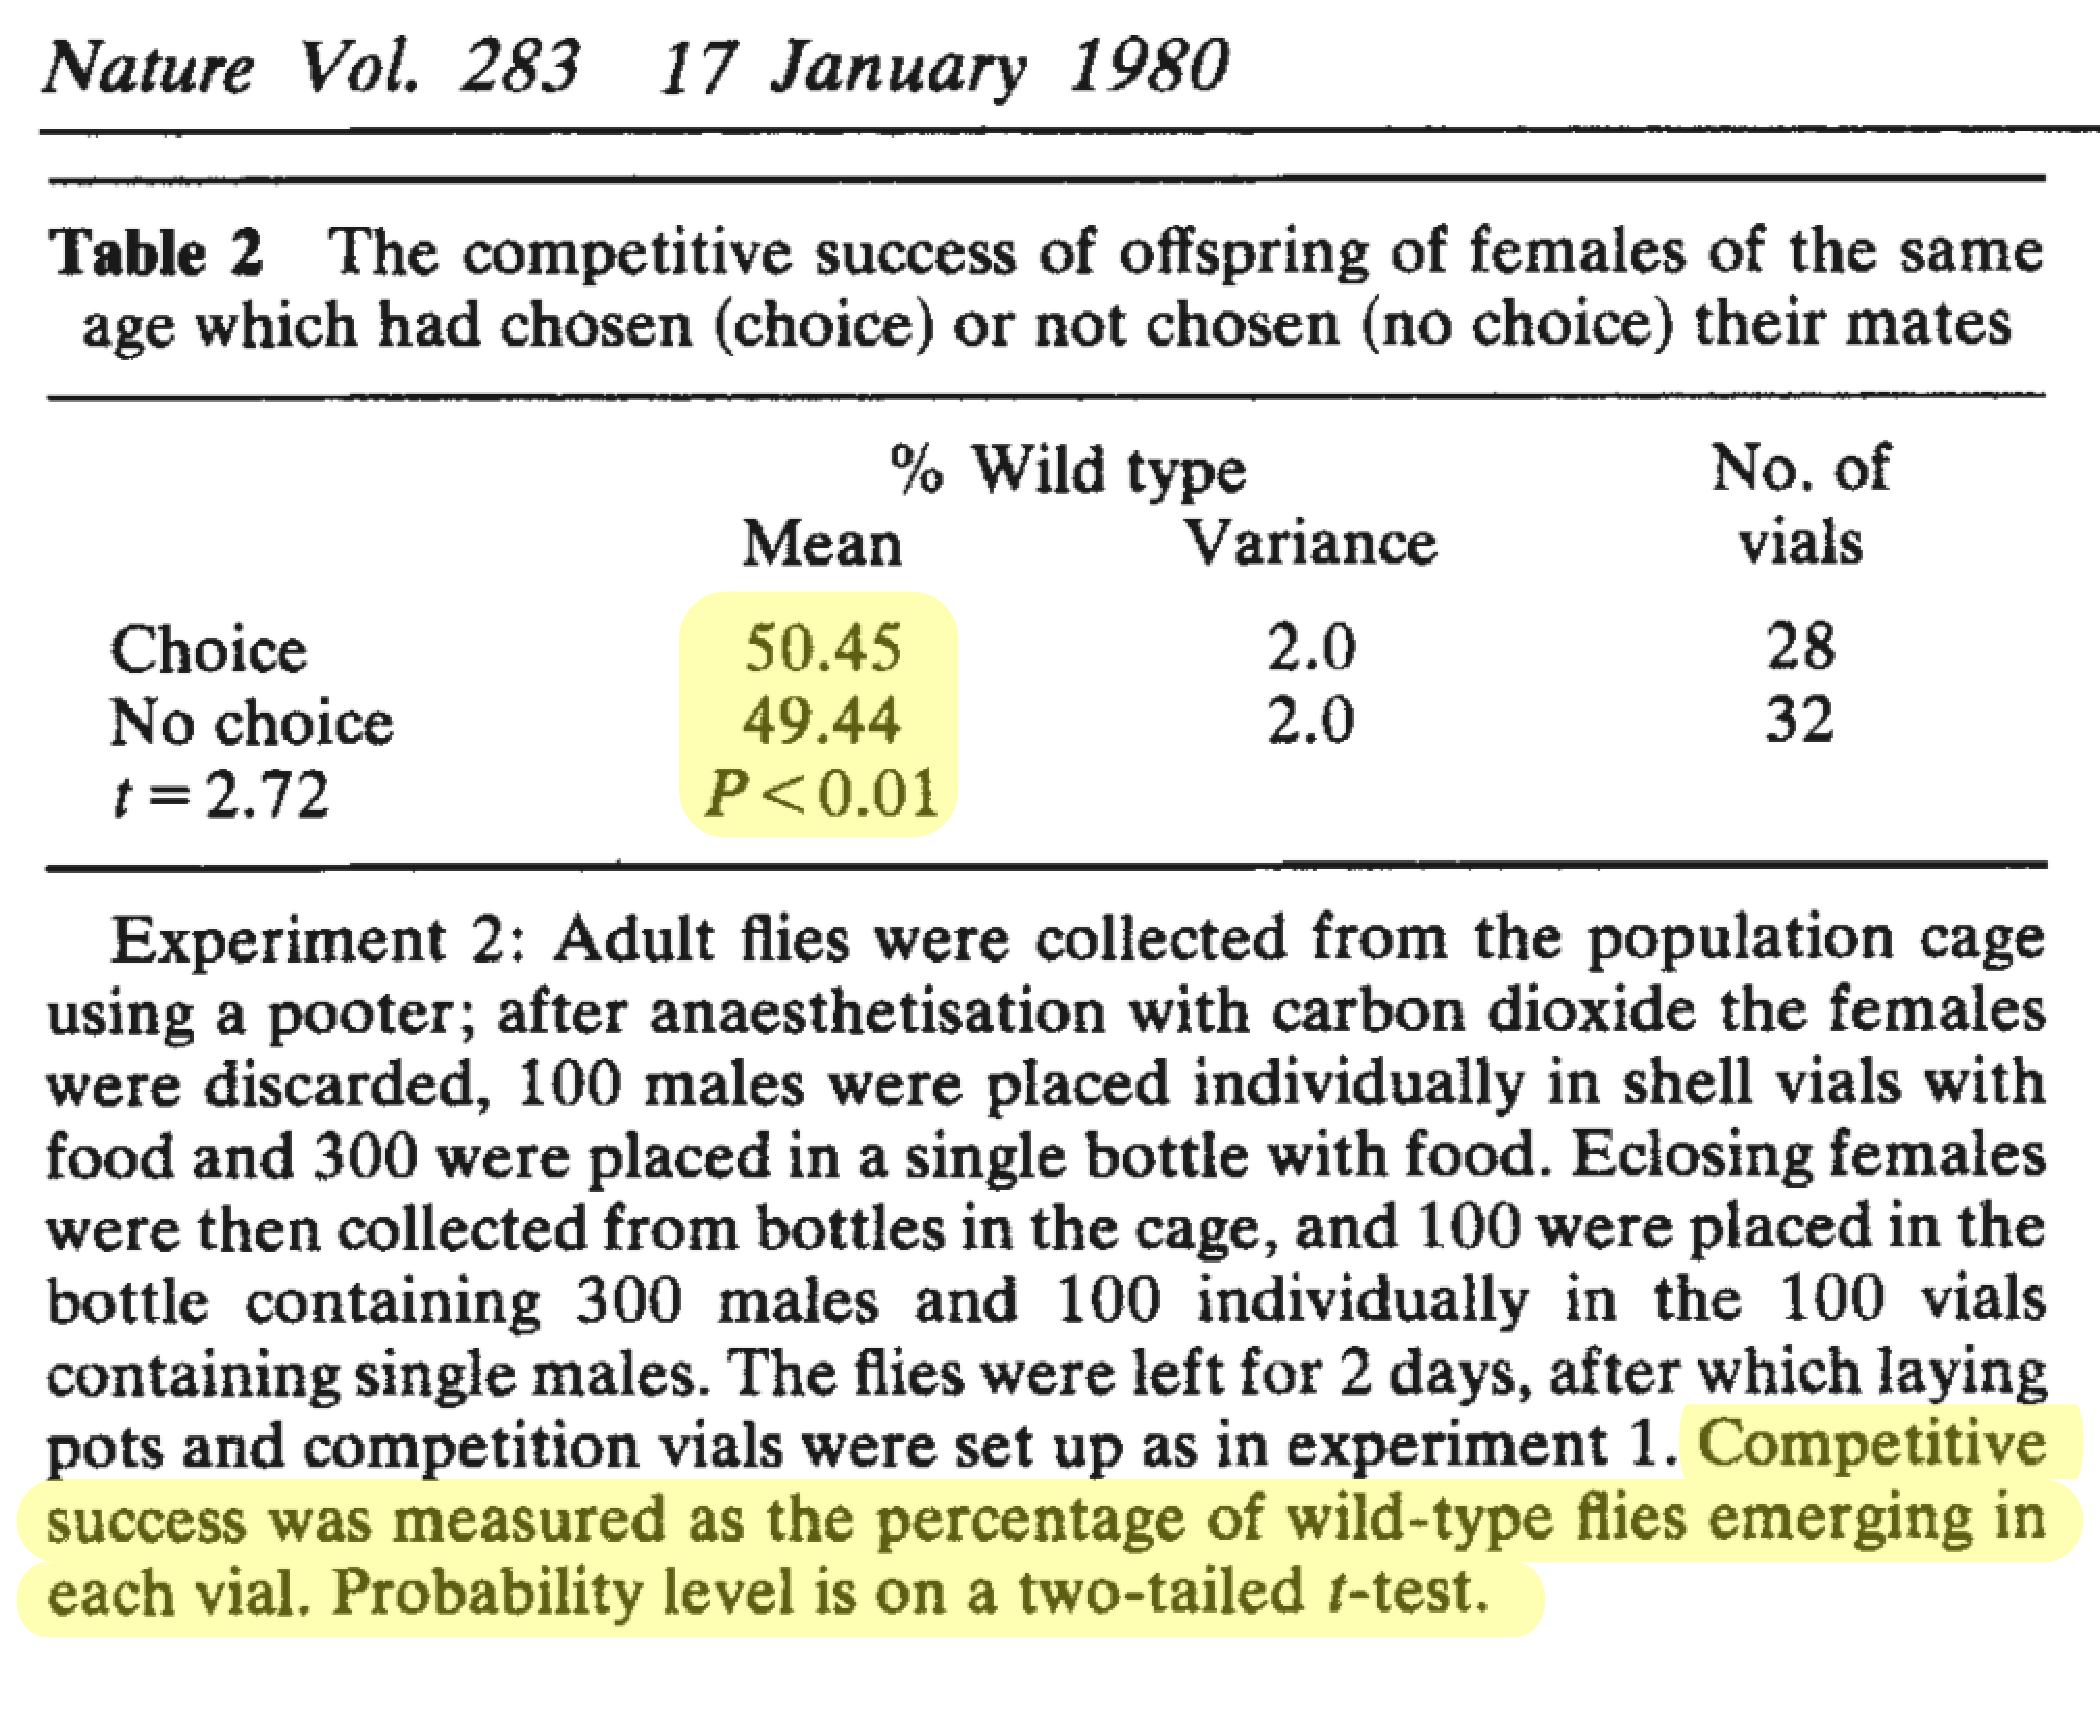
Paper published in Nature with p-value < 0.01
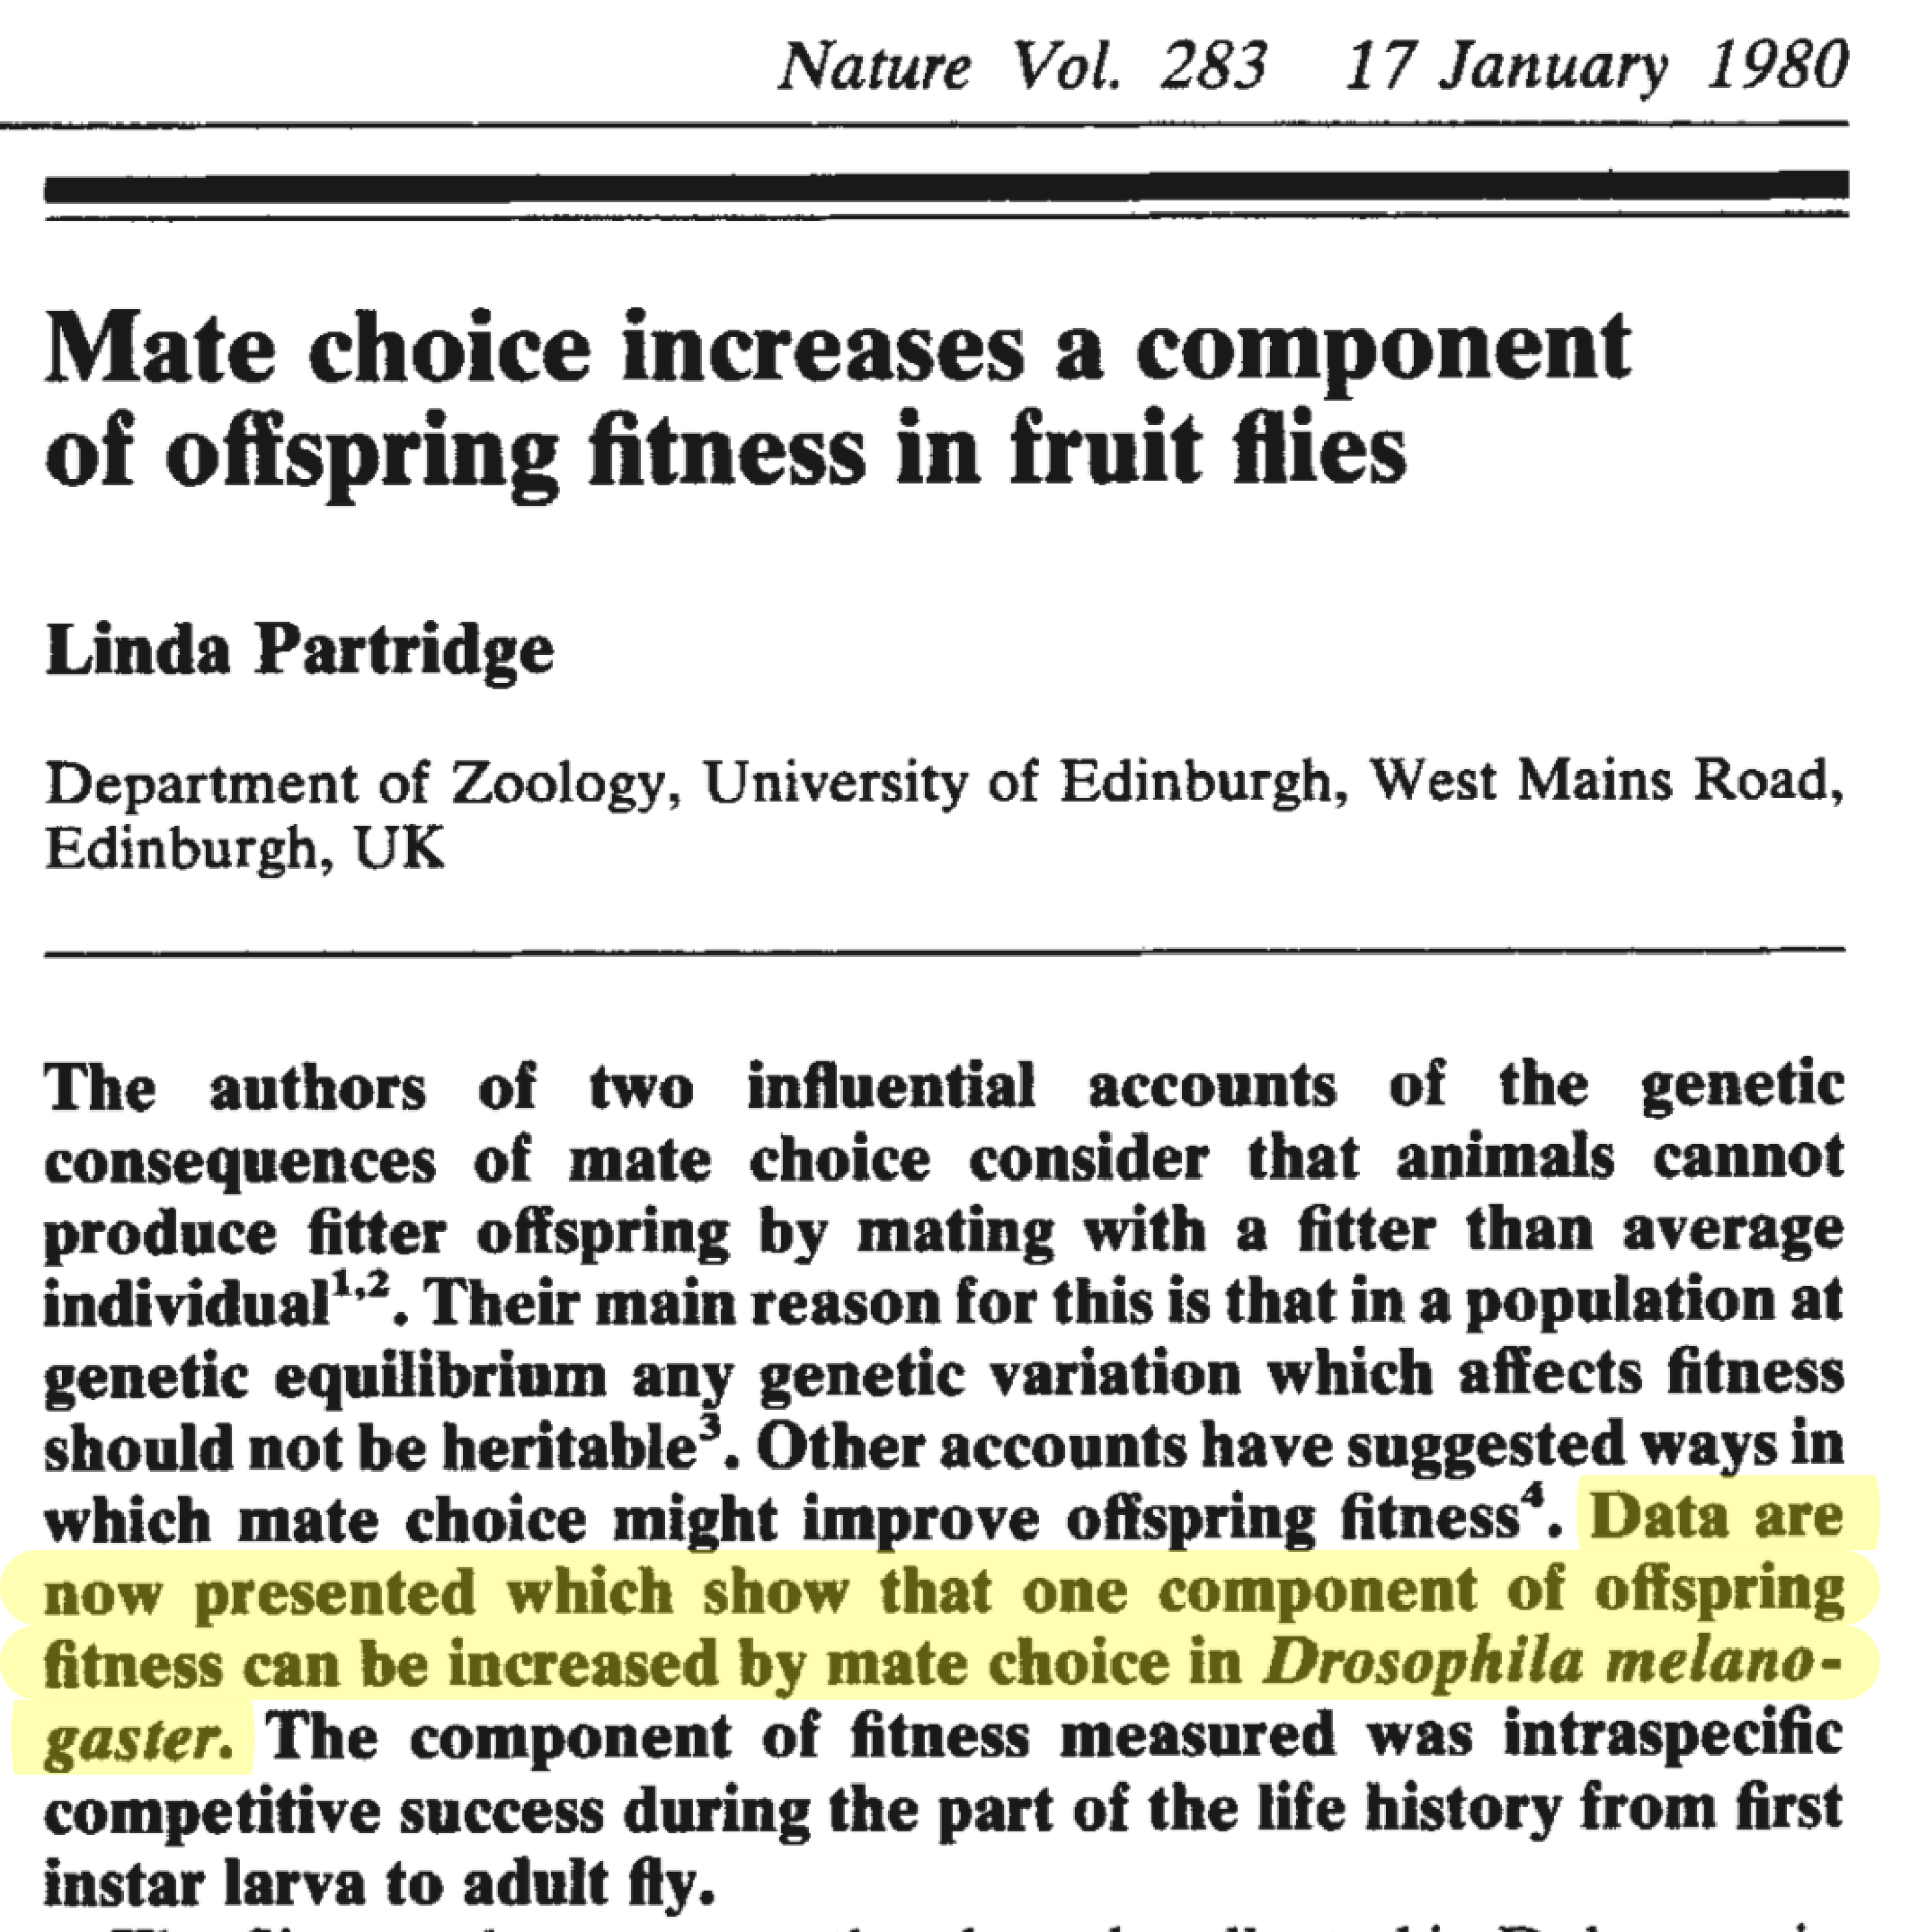
Original study
Paper published in Nature with p-value < 0.01
Concluded, based on the data, that mate choice improves offspring fitness.
This went against conventional wisdom.
Researchers at Penn State tried to replicate the results…
Follow up study
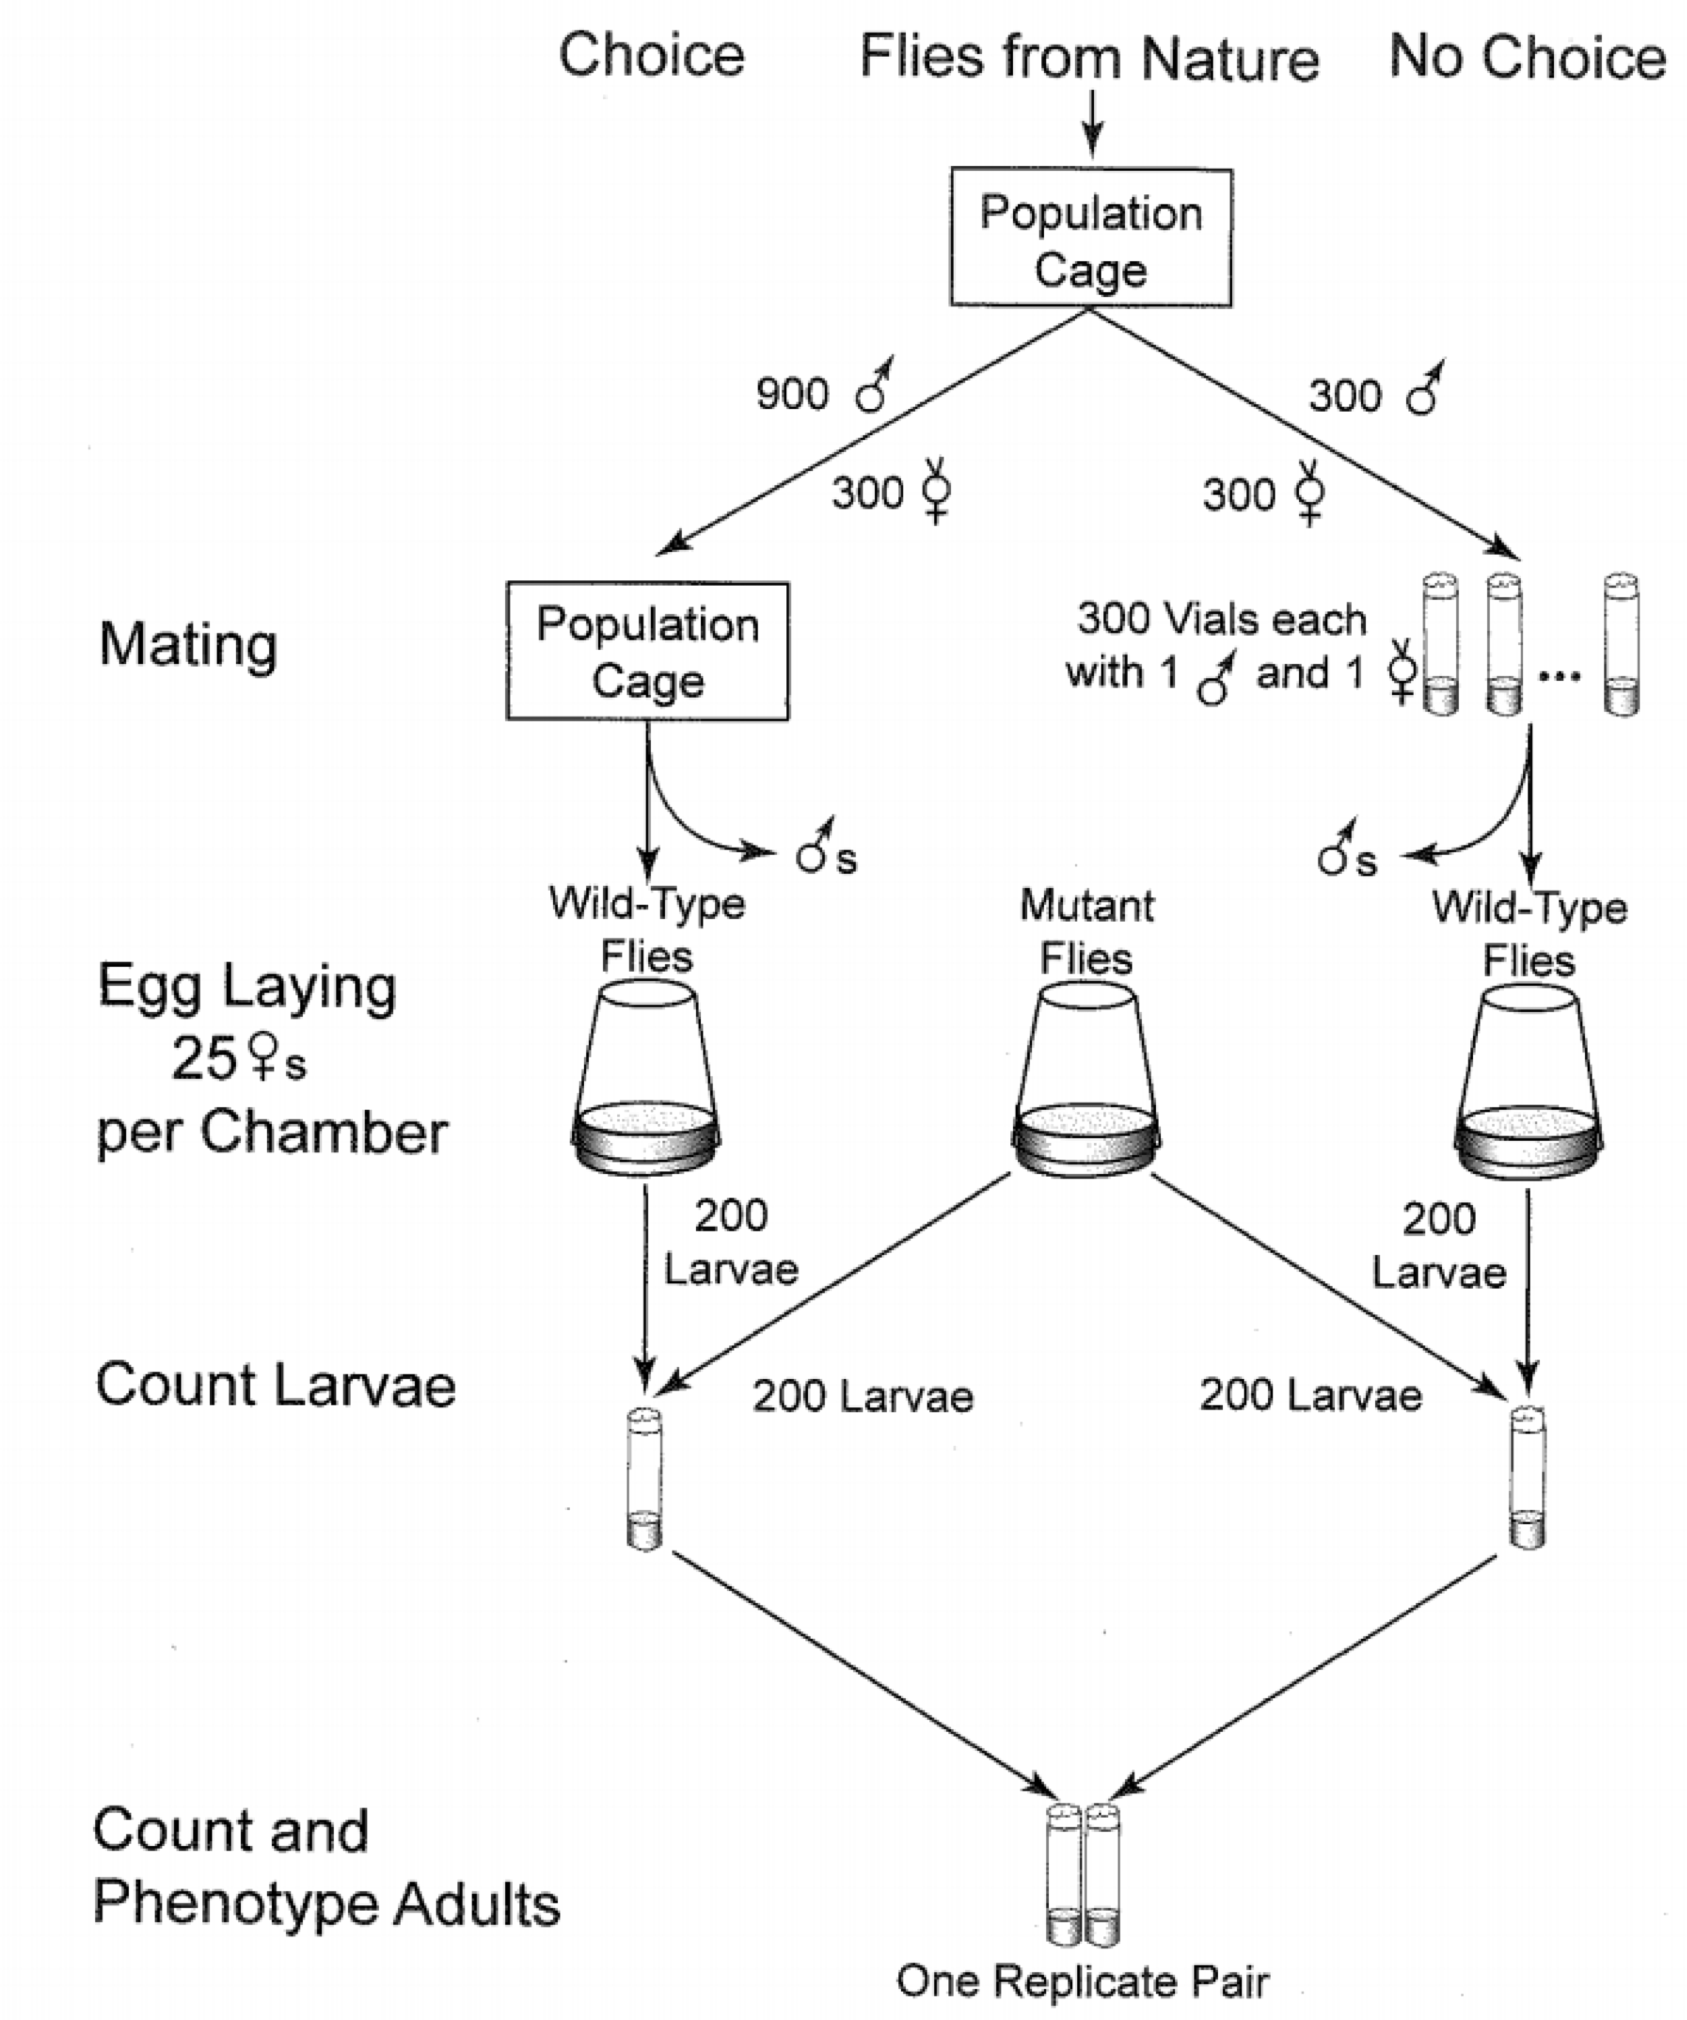
600 female fruit flies, randomly divided:
- 300 placed in a cage with 900 males (mate choice)
- 300 placed in individual vials with only one male each (no mate choice)
After mating, females were separated from the males and put in egg-laying chambers.
200 larvae from each chamber were taken and placed in a cage with 200 mutant flies (for competition).
Offspring survival rate was measured.
Follow up study
Experiment repeated 10 times/day for 5 days (50 runs, 10000 larvae tested in each group).
| Larvae survived? |
Mate choice? | ||
| Yes | No | Total | |
| Yes | 6067 | 5976 | 12043 |
| No | 3933 | 4024 | 7957 |
| Total | 10000 | 10000 | 20000 |
Difference in survival rate:
$d=\overset{\hat{}}{p}_\textrm{choice}-\overset{\hat{}}{p}_\textrm{no choice}$
$d=0.6067-0.5976=0.009$
One-tail p-value = 0.102
Mate choice and offspring survival
Two studies investigated the same topic.
One study found significant results. ($p<0.01$)
One study found insignificant results. ($p=0.102$)
Conflicting results?
Errors in significance testing
Errors can happen!
- A Type I error is rejecting a true null (false positive)
- A Type II error is not rejecting a false null (false negative)
| Decision | |||
| Reject H$_0$ | Do not reject H$_0$ | ||
| Truth | H$_0$ true | Type I error | |
| H$_0$ false | Type II error | ||
Errors in significance testing
Errors can happen!
- A Type I error is rejecting a true null (false positive)
- A Type II error is not rejecting a false null (false negative)

Mate choice and offspring survival
Option #1:
The original study (p-value < 0.01) made a Type I error, and H$_0$ is really true
Option #2:
The second study (p-value = 0.102) made a Type II error, and H$_a$ is really true
Option #3:
No errors were made; different experimental settings yielded different results
What is the probability of making a Type I or Type II error?
Probability of Type I error
If the null hypothesis is true:
- 5% of statistics will be in the most extreme 5%
- 5% of statistics will give p-values less than 0.05
- 5% of statistics will lead to rejecting H$_0$ at $\alpha=0.05$
If $\alpha=0.05$, there is a 5% chance of a Type I error
If the null hypothesis is true:
- 1% of statistics will be in the most extreme 1%
- 1% of statistics will give p-values less than 0.01
- 1% of statistics will lead to rejecting H$_0$ at $\alpha=0.01$
If $\alpha=0.01$, there is a 1% chance of a Type I error
Probability of Type I error
The probability of making a Type I error (rejecting a true null) is the significance level, $\alpha$.
Probability of Type II error
How can we reduce the probability of making a Type II Error (not rejecting a false null)?
($=$ How could we increase the probability of rejecting the null?)
Increase the sample size
Larger sample size makes it easier to reject the null
(decrease the variability of the sampling distribution)
increase $n$ to decrease chance of Type II error
- With small sample sizes, even large differences or effects may not be statistically significant, and Type II errors are common
- But with large sample sizes, even a very small difference or effect can be statistically significant … (we'll talk about this a bit later, Statistical vs. Practical significance)
Larger sample sizes makes it more likely to reject the null
Set 1:
Mean: 16
SD: 5
Set 2:
Mean: 20
SD: 5
$\bar{x}_2-\bar{x}_1=4$
(n=9)
$p=0.1109$
(n=15)
$p=0.0376$
(n=21)
$p=0.0132$
Probability of Type II error
How can we reduce the probability of making a Type II Error (not rejecting a false null)?
($=$ How could we increase the probability of rejecting the null?)
Increase the sample size
Increase the significance level
Significance Level and Errors
Increase $\alpha$ to reduce the chance of Type II error
Decrease $\alpha$ to reduce the chance of Type I error
Significance Level and Errors
While we wish to avoid both types of errors, in practice we have to accept some trade-off between them:
- If we set $\alpha$ to be very low, we make it very hard to reject H$_0$ and we reduce the chance of making a Type I error (If we make $\alpha$ smaller, fewer samples would be considered "extreme", meaning we would reject H$_0$ less often), but then we would make Type II errors more often.
- On the other hand, setting a larger $\alpha$ makes it easier to reject H$_0$ (more samples would be considered "extreme") and we would reduce the chance of making a Type II error. But we would also increase the chance of making a Type I error, ending up rejecting too many H$_0$’s that were actually true.
This balance is set by how easy or hard it is to reject H$_0$, which is exactly determined by the significance level! ($\alpha$)
Understanding the Significance Level
The significance level $\alpha$, represents the tolerable probability of making a Type I error.
If the consequences of a Type I error are severe (for example, approving a new drug that is potentially dangerous) we might use a very small $\alpha$ (perhaps even $\alpha=0.005$).
If the consequences of a Type II error are severe (for example, failing to diagnose a treatable disease), we would want to make it easier to reject H$_0$, so we might use a relatively large $\alpha$.
However, remember that there is always a trade-off between the two types of errors, so we usually use the common significance levels of 5%, 10% or 1%.
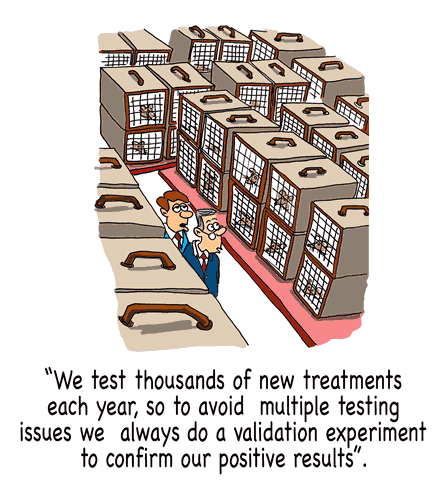
The problem of multiple testing
Because the chance of a Type I error is $\alpha$ …
$\alpha$ of all tests with true null hypotheses will yield significant results just by chance.
If 100 tests are done with $\alpha=0.05$ and nothing is really going on (the null hypothesis is really true), 5% of them will yield significant results (reject the null), just by chance.
This is known as the problem of multiple testing
Consider a topic that is being investigated by research teams all over the world:
Using $\alpha=0.05$, 5% of teams are going to find something significant, even if the null hypothesis is true.
Consider a research team/company doing many hypothesis tests:
Using $\alpha=0.05$, 5% of the tests are going to be significant, even if the null hypotheses are all true.
multiple hypothesis tests
The problem of multiple testing
When multiple tests are conducted, if the null hypotheses are all true, the proportion of all the tests that will yield statistically significant results just by random chance is about $\alpha$, the significance level.
Mate choice and offspring survival
The experiment was actually comprised of 50 smaller experiments. (experiment repeated 10 times/day for 5 days - 50 runs, 10000 larvae tested in each group).
| Larvae survived? |
Mate choice? | ||
| Yes | No | Total | |
| Yes | 6067 | 5976 | 12043 |
| No | 3933 | 4024 | 7957 |
| Total | 10000 | 10000 | 20000 |
What if we had calculated the p-value for each run?
50
p-values
| 0.9570 | 0.8498 | 0.1376 | 0.5407 | 0.7640 | 0.9845 | 0.3334 | 0.8437 | 0.2080 | 0.8912 |
| 0.8879 | 0.6615 | 0.6695 | 0.8764 | 1.0000 | 0.0064 | 0.9982 | 0.7671 | 0.9512 | 0.2730 |
| 0.5812 | 0.1088 | 0.0181 | 0.0013 | 0.6242 | 0.0131 | 0.7882 | 0.0777 | 0.0001 | 0.9641 |
| 0.8851 | 0.1280 | 0.3421 | 0.1805 | 0.1121 | 0.6562 | 0.0133 | 0.3082 | 0.6923 | 0.1925 |
| 0.4207 | 0.0607 | 0.3059 | 0.2383 | 0.2391 | 0.1584 | 0.1735 | 0.0319 | 0.0171 | 0.1082 |
What if we just reported the run that yielded a p-value of 0.0001?
Is that ethical?
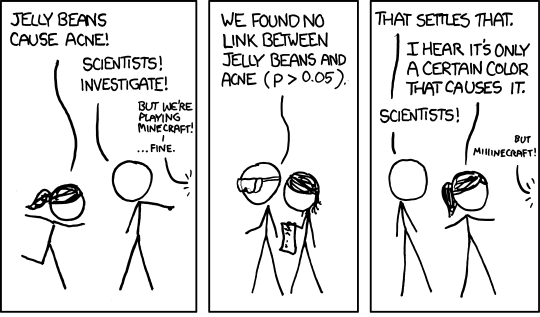
Publication bias
Publication bias refers to the fact that usually only the significant results get published.
The one study that turns out significant gets published, and no one knows about all the insignificant results (also known as the file drawer problem)
Publication bias, combined with the problem of multiple testing can yield very misleading results.
Jelly Beans cause acne!
Jelly Beans cause acne!

Jelly Beans cause acne!
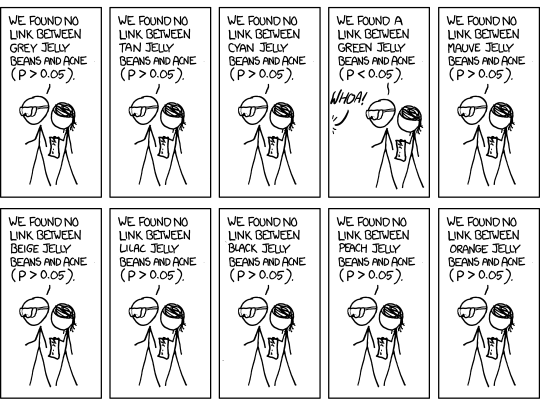
Jelly Beans cause acne!

Eating chocolate to lose weight


Eating chocolate to lose weight
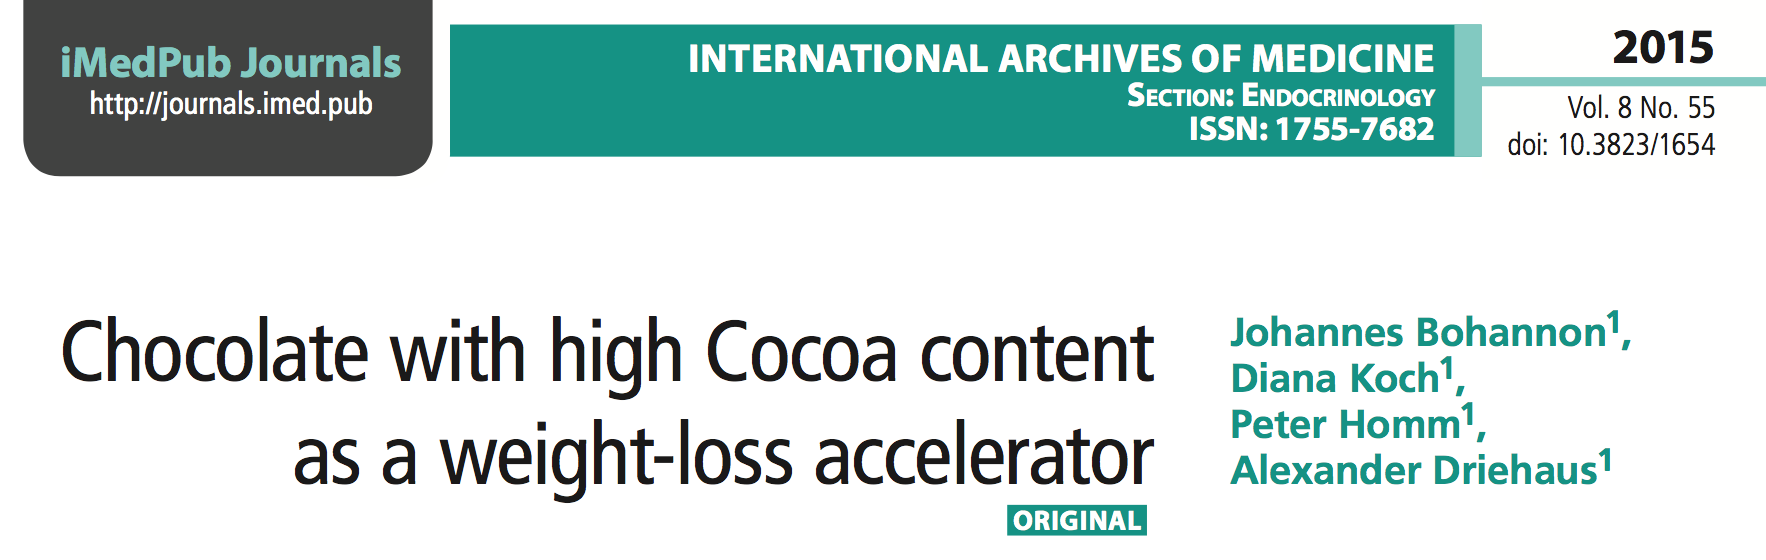

The study was 100 percent authentic. My colleagues and I recruited actual human subjects in Germany. We ran an actual clinical trial, with subjects randomly assigned to different diet regimes. And the statistically significant benefits of chocolate that we reported are based on the actual data.
It was, in fact, a fairly typical study for the field of diet research. Which is to say: It was terrible science. The results are meaningless, and the health claims that the media blasted out to millions of people around the world are utterly unfounded.
Eating chocolate to lose weight
I know what you’re thinking. The study did show accelerated weight loss in the chocolate group—shouldn’t we trust it? Isn’t that how science works?
Here’s a dirty little science secret: If you measure a large number of things about a small number of people, you are almost guaranteed to get a “statistically significant” result. Our study included 18 different measurements—weight, cholesterol, sodium, blood protein levels, sleep quality, well-being, etc.—from 15 people. (One subject was dropped.) That study design is a recipe for false positives (Type I error).
Multiple Testing and Publication Bias
- $\alpha$ of all tests with true null hypotheses will yield significant results just by chance
- The one that happens to be significant is the one that gets published
Reproducibility crisis

Newspapers never covered initial studies reporting null findings and rarely reported subsequent null observations. Only 48.7% of the 156 studies reported by newspapers were confirmed by the corresponding meta-analyses.
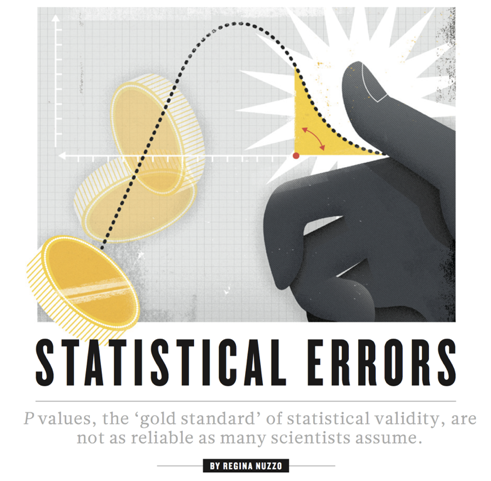
The p-value was never meant to be used the way it's used today
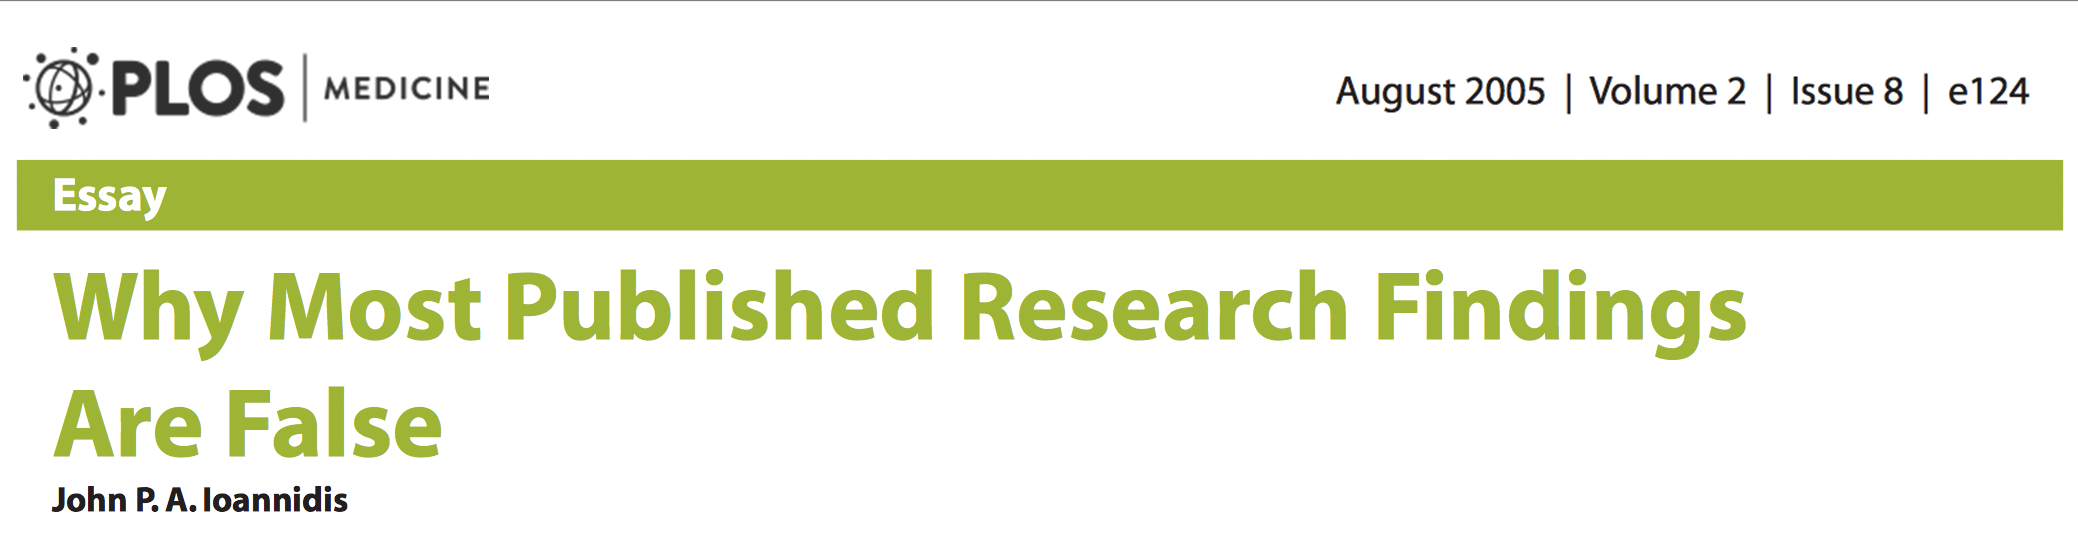
It can be proven that most claimed research findings are false.
Reproducibility crisis

Many researchers believe that if scientists set out to reproduce preclinical work published over the past decade, a majority would fail. This, in short, is the reproducibility crisis.
A recent study tried to replicate 100 results published in psychology journals: 97% of the original results were significant, only 36% of replicated results were significant
Everything we eat both causes and prevents cancer
Each is one medical study
Schoenfeld J. and Ioannidis JPA (2013). 'Is everything we eat associated with cancer? A systematic cookbook review'. Am J Clin Nutr 97:1 127-134
Sometimes we get into confusing situations
A single study is rarely the final answer.
And yet for science reporters, new studies are irresistible — a bold new finding makes a great headline.


Is this situation hopeless?
Point #1:
Errors (type I and II) are possible
Point #2:
Multiple testing and publication bias are a huge problem
What can you do?
- Recognize (and be skeptical) when a claim is one of many tests
- Look for replication of results
Replication
Replication (or reproducibility) of a study in another setting or by another researcher is extremely important!
Studies that have been replicated with similar conclusions gain credibility
Studies that have been replicated with different conclusions lose credibility
Replication helps guard against Type I errors AND helps with generalizability
Replication and Multiple testing

J.B. Landers (CAUSEweb.org)
Mate choice and offspring survival
Actually, the research at Penn State included 3 different experiments; two different species of fruit flies and three different mutant types.
- Drosophila melanogaster, Mutant: sparkling eyes
- Drosophila melanogaster, Mutant: white eyes
- Drosophila pseudoobscura, Mutant: orange eyes
Multiple possible outcomes (% surviving in each group, % of survivors who were from experimental group (not mutants)
Multiple ways to analyze – proportions, quantitative paired analysis
Mate choice and offspring survival
Original study:
Significant in favor of choice
(p < 0.01)
Follow-up study #1:
Not significant
$\frac{6067}{10000}-\frac{5976}{10000}= 0.6067 - 0.5976 = \fragindex{1}{\fraglight{highlight-current-bckg-red}{0.009}}$
($p = 0.102$)
Follow-up study #2:
Significant in favor of no choice
$\frac{4579}{10000}-\frac{4749}{10000}= 0.4579 - 0.4749 = \fragindex{1}{\fraglight{highlight-current-bckg-red}{-0.017}}$
($p= 0.008$)
Follow-up study #3:
Significant in favor of no choice
$\frac{1641}{5000}-\frac{1758}{5000}= 0.3282 - 0.3516 =
\fragindex{1}{\fraglight{highlight-current-bckg-red}{-0.02}}$
($p=0.007$)
Statistical vs Practical Significance
Suppose a weight loss program recruits 10,000 people for a randomized experiment.
Because of the huge sample size, a difference in average weight loss of only 0.5 lbs could be found to be statistically significant
Suppose the experiment lasted for a year.
Is a loss of ½ a pound practically significant?
A statistically significant result is not always practically significant, especially with large sample sizes
What do we do then?
Report confidence intervals
Set 1:
Mean: 16
SD: 5
Set 2:
Mean: 20
SD: 5
$\bar{x}_2-\bar{x}_1=4$
(n=9)
$p=0.1109$
(n=15)
$p=0.0376$
(n=21)
$p=0.0132$
What is really important here, is not so much if the p-value suggests a statistical significant result or not, but the actual value of the effect of your treatment ($\bar{x}_2-\bar{x}_1=4$)
Report confidence intervals

Summary
Conclusions based off p-values are not perfect
Type I and Type II errors can happen
$\alpha$ of all tests will be significant just by chance and often, only the significant results get published
Replication of results is important
Larger sample sizes make it easier to get significant results
Reporting confidence intervals along/instead of the p-value
gives you an estimate of the true
value of your effect (treatment).
This is what is of practical importance.
Note: for more details, see the 2016 American Statistical Association’s Statement on p-values