Stats 13
Lecture 16
Machine Learning
Brooke Wenig + Guillaume Calmettes
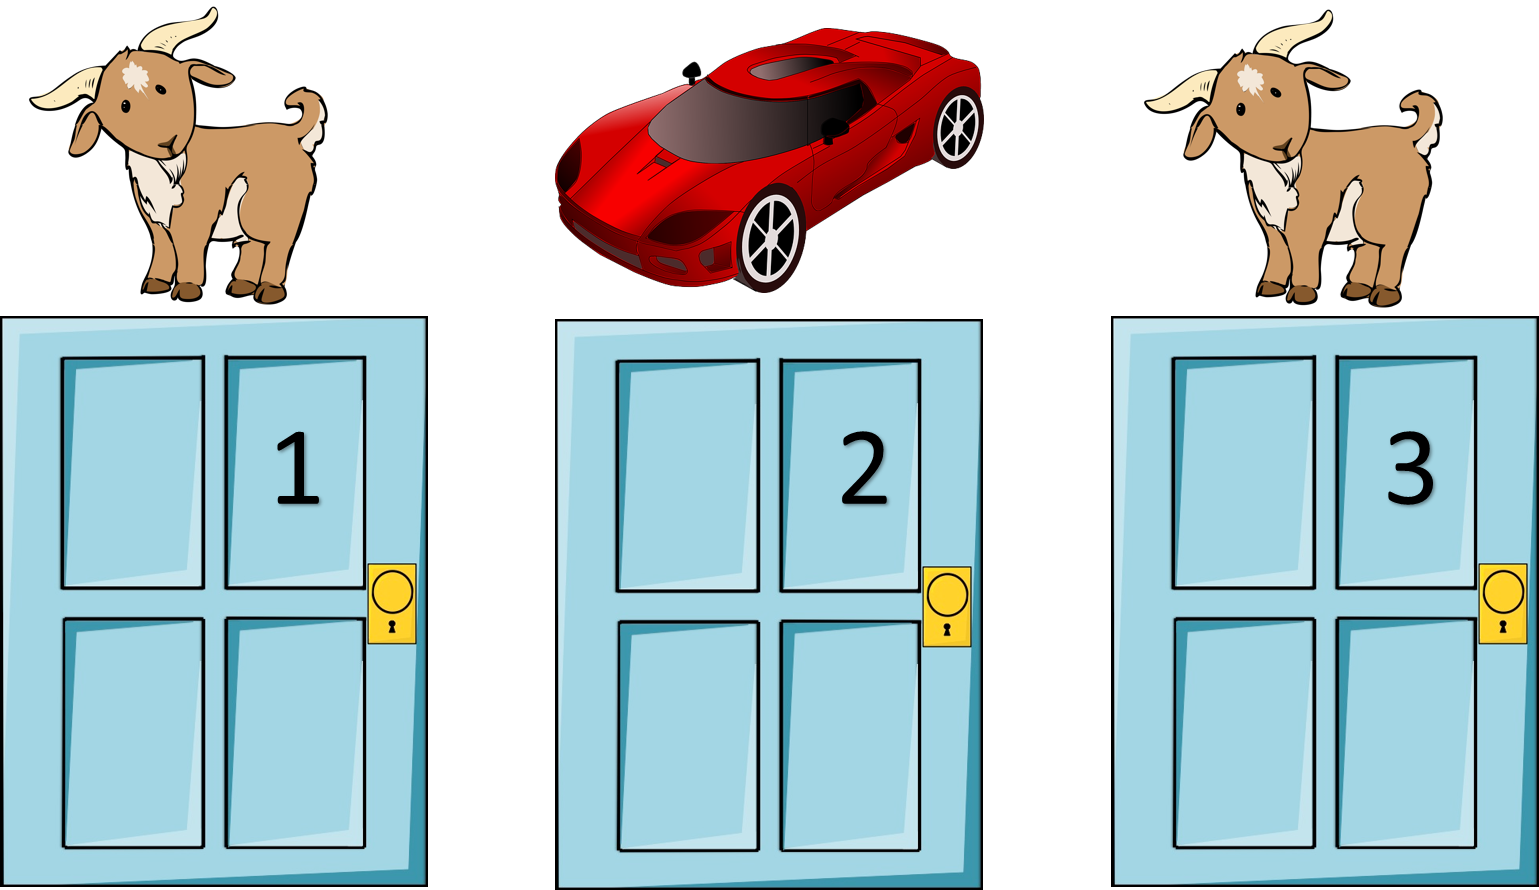
Monty Hall Problem

Monty Hall Problem
| What is really behind | What the result will be | |||
| Door 1 | Door 2 | Door 3 | Staying at door 1 | Switching to the door offered |
| Car | Goat | Goat | Wins car | Wins goat |
| Goat | Car | Goat | Wins goat | Wins car |
| Goat | Goat | Car | Wins goat | Wins car |
| Chance of getting the car: | $1/3$ | $2/3$ | ||
What is Machine Learning?
Computer algorithms that learn patterns in your data.
Note:
Computers are vulnerable to making mistakes, like humans (will talk about this at the end)

Decision Making

Model this in Python?
          if salary < 50k:
            Decline offer
          else if salary > 50k and commute > 1 hr
            Decline offer
Decision Tree
Really, it's an upside tree
(leaves on bottom)
Leaf:
Terminal node (no child)
Internal Node:
Splits the predictor space

Choosing a Restaurant
| Examples | Attributes | Target Wait | |||||||||
| Alt | Bar | Fri | Hun | Pat | Price | Rain | Res | Type | Est | ||
| $X_1$ | T | F | F | T | Some | F | T | French | 0-10 | T | |
| $X_2$ | T | F | F | T | Full | F | F | Thai | 30-60 | F | |
| $X_3$ | F | T | F | F | Some | F | F | Burger | 0-10 | T | |
| $X_4$ | T | F | T | T | Full | F | F | Thai | 10-30 | T | |
| $X_5$ | T | F | T | F | Full | F | T | French | >60 | F | |
| $X_6$ | F | T | F | T | Some | T | T | Italian | 0-10 | T | |
| $X_7$ | F | T | F | F | None | T | F | Burger | 0-10 | F | |
| $X_8$ | F | F | F | T | Some | T | T | Thai | 0-10 | T | |
| $X_9$ | F | T | T | F | Full | T | F | Burger | >60 | F | |
| $X_{10}$ | T | T | T | T | Full | F | T | Italian | 10-30 | F | |
| $X_{11}$ | F | F | F | F | None | F | F | Thai | 0-10 | F | |
| $X_{12}$ | T | T | T | T | Full | F | F | Burger | 30-60 | T | |
Which attribute to split?

Patrons is a better choice because it gives more information about the classification
Goal: Minimize Entropy
$H[X] = -\sum_{k=1}^K P(X = a_{k})*log(P(X = a_{k}))$

Depth
- Depth: Longest path from root to a leaf node
- If too deep, can overfit
- If too shallow, underfits

Create trees
Grow tree until stopping criteria reached (max depth, minimum information gain, etc.)
Greedy, recursive partitioning

Comparison
Pros
- Interpretable
- Simple
Cons
- Poor accuracy
- High variance (if change training data a little, tree structure changes drastically)
Bias vs Variance

Bagging
Averaging a set of observations reduces variance.
But we only have one training set ... or do we?

Bootstrap
Simulate new datasets:
Take samples (with replacement) from original training set
Repeat $n$ times

The 632 rule
Sample has $n$ elements.
Probability of getting picked:
Probability of not getting picked:
If you sample $n$ elements with replacement, the probability for each element of not getting picked in the sample is then: $(1-\frac{1}{n})^n$
As ${n\to\infty}$, this probability approaches $\frac{1}{e}\approx.368$
Thus, $0.632$ of the data points in your original sample show up in the Bootstrap sample (the other $0.368$ won't be present in it)
Bootstrap samples
Each bootstrap sample:
n=100, drawing WITH replacement
from original sample
Not selected
Selected 1 time
Selected 2 times
Selected $\geq$3 times
Theory: 0.632
Bagging
Train a tree on each bootstrap sample, and average their predictions (Bootstrap Aggregating)
Can grow deep trees!
Random Forests
Like bagging, but removes correlation among trees.
At each split, considers only a subset of predictors.

Notes:
Random forest typically considers $\sqrt{\textrm{number of features}}$ at each split (if 10 features, then it considers $\sqrt{10}\approx3$ features), and picks the best one.
Random Forests

The Dangers of Machine Learning
Let's build a classifier


What did the computer learn?

A grass classifier!
Overfitting
Superstition is overfitting to your training data.

Underfitting
Failing to learn from your mistakes = underfitting.

Conclusion
Sexiest job of the 21$^{st}$ century?
I keep saying the sexy job in the next ten years will be statisticians. People think I’m joking, but who would’ve guessed that computer engineers would’ve been the sexy job of the 1990s?
- Google’s Chief Economist Hal Varian (2009) -
Data Scientist vs. Statistician?
A data scientist is a statistician that lives in San Francisco.
Data science is statistics on a Mac.
A data scientist is someone who is better at statistics than any software engineer and better at software engineering than any statistician
Right or left skewed?
Plus, they are paid more:
Mean salary: $\$120,000$
Median salary: $\$126,000$
Plans after graduation?
Grad school? Departmental Scholars
Industry? Check out data science bootcamps!