Introduction to statistical methods
for the life and health sciences
Bonjour, I'm Guillaume
The administrative stuff
Lectures:
Tuesdays & Thursdays
3:30-4:45PM
Labs:
Mondays & Wednesdays
10:00-10:50AM
Grading:
Homeworks (25%)
Midterm (35%)
Final (35%)
Participation (5%)
No official textbook
Homeworks: assigned Mondays (11:00AM)
due before the next Monday (10:00AM)
Office hours:
W/F: 1:30-3:30PM (MRL 3761)
Class-related communication:
Piazza forum (peer learning)
Understanding > knowing
Getting an answer is very different from knowing WHY
we get this answer.
Understanding statistics implies understanding the
underlying process leading to the answer we get.
Motivation for this class
What we teach is largely the technical machinery of numerical approximations based on the normal
distribution and its many subsidiary cogs.
This machinery was once necessary, because
the conceptually simpler alternative based on permutations was computationally beyond our reach [...]
Before computers statisticians had no choice. These days we have no excuse.
Randomization-based
inference makes a direct connection between data production and the logic of inference that
deserves to be at the core of every introductory course.”
George W. Cobb (2005 USCOTS presentation)
Stats 13
Lecture 1
Introduction
Guillaume Calmettes
Statistics?
Making decisions based on Data!
Statistics is the science of
collecting, organizing, presentating, analyzing, and interpreting
data
to assist
in making more effective decisions.
Statistics is not an exact science
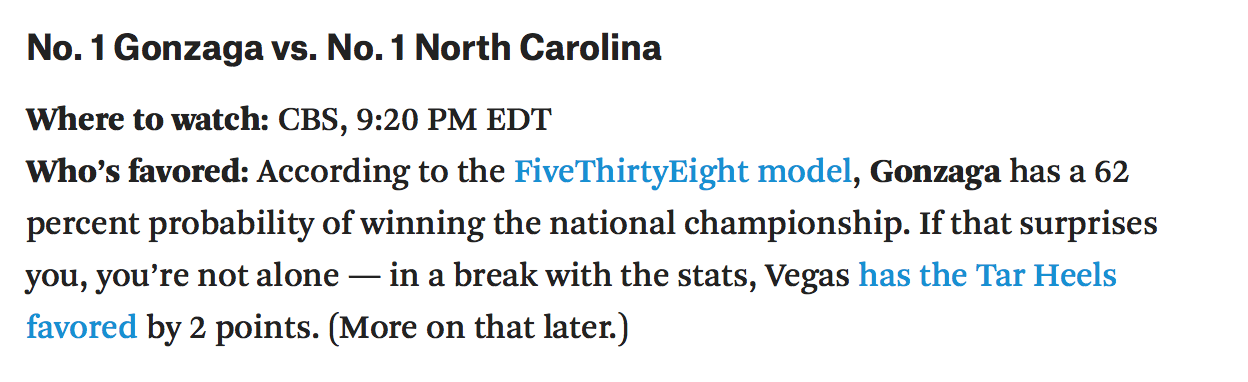
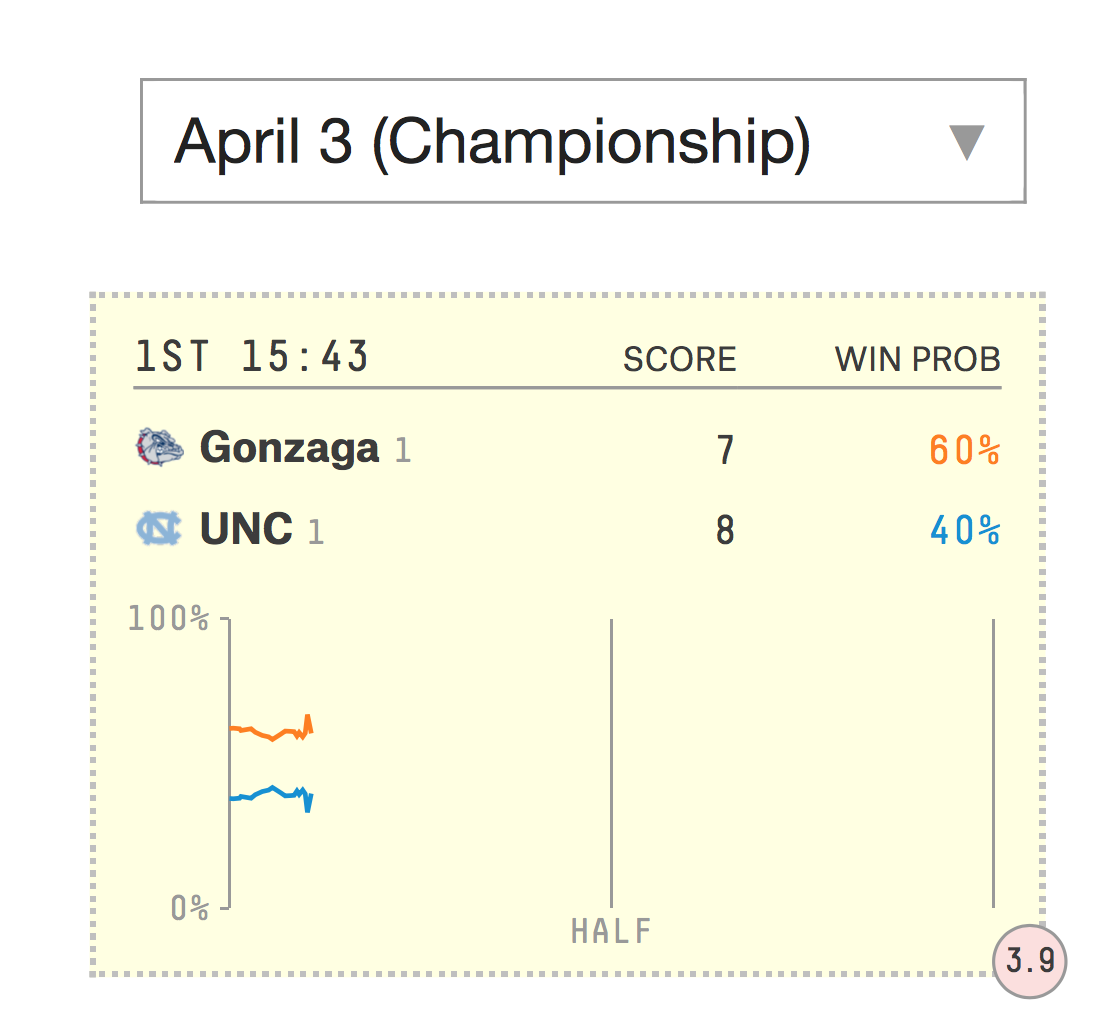
2017 NCAA Finale (Apr 3)
Statistics is not an exact science
2017 NCAA Finale (Apr 3)
Statistics: Numbers
(players' height, offensive points, opposite team score, ...)
Bookmakers: Numbers + history ("team experience")
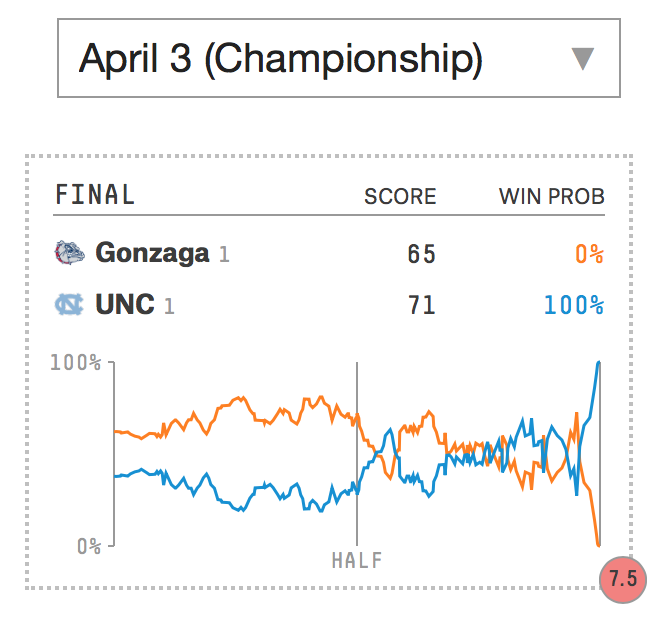
Statistics is not an exact science
2017 NCAA Finale (Apr 3)
There is no RIGHT or WRONG in Statistics,
there is only
(most) likely or
(most) unlikely
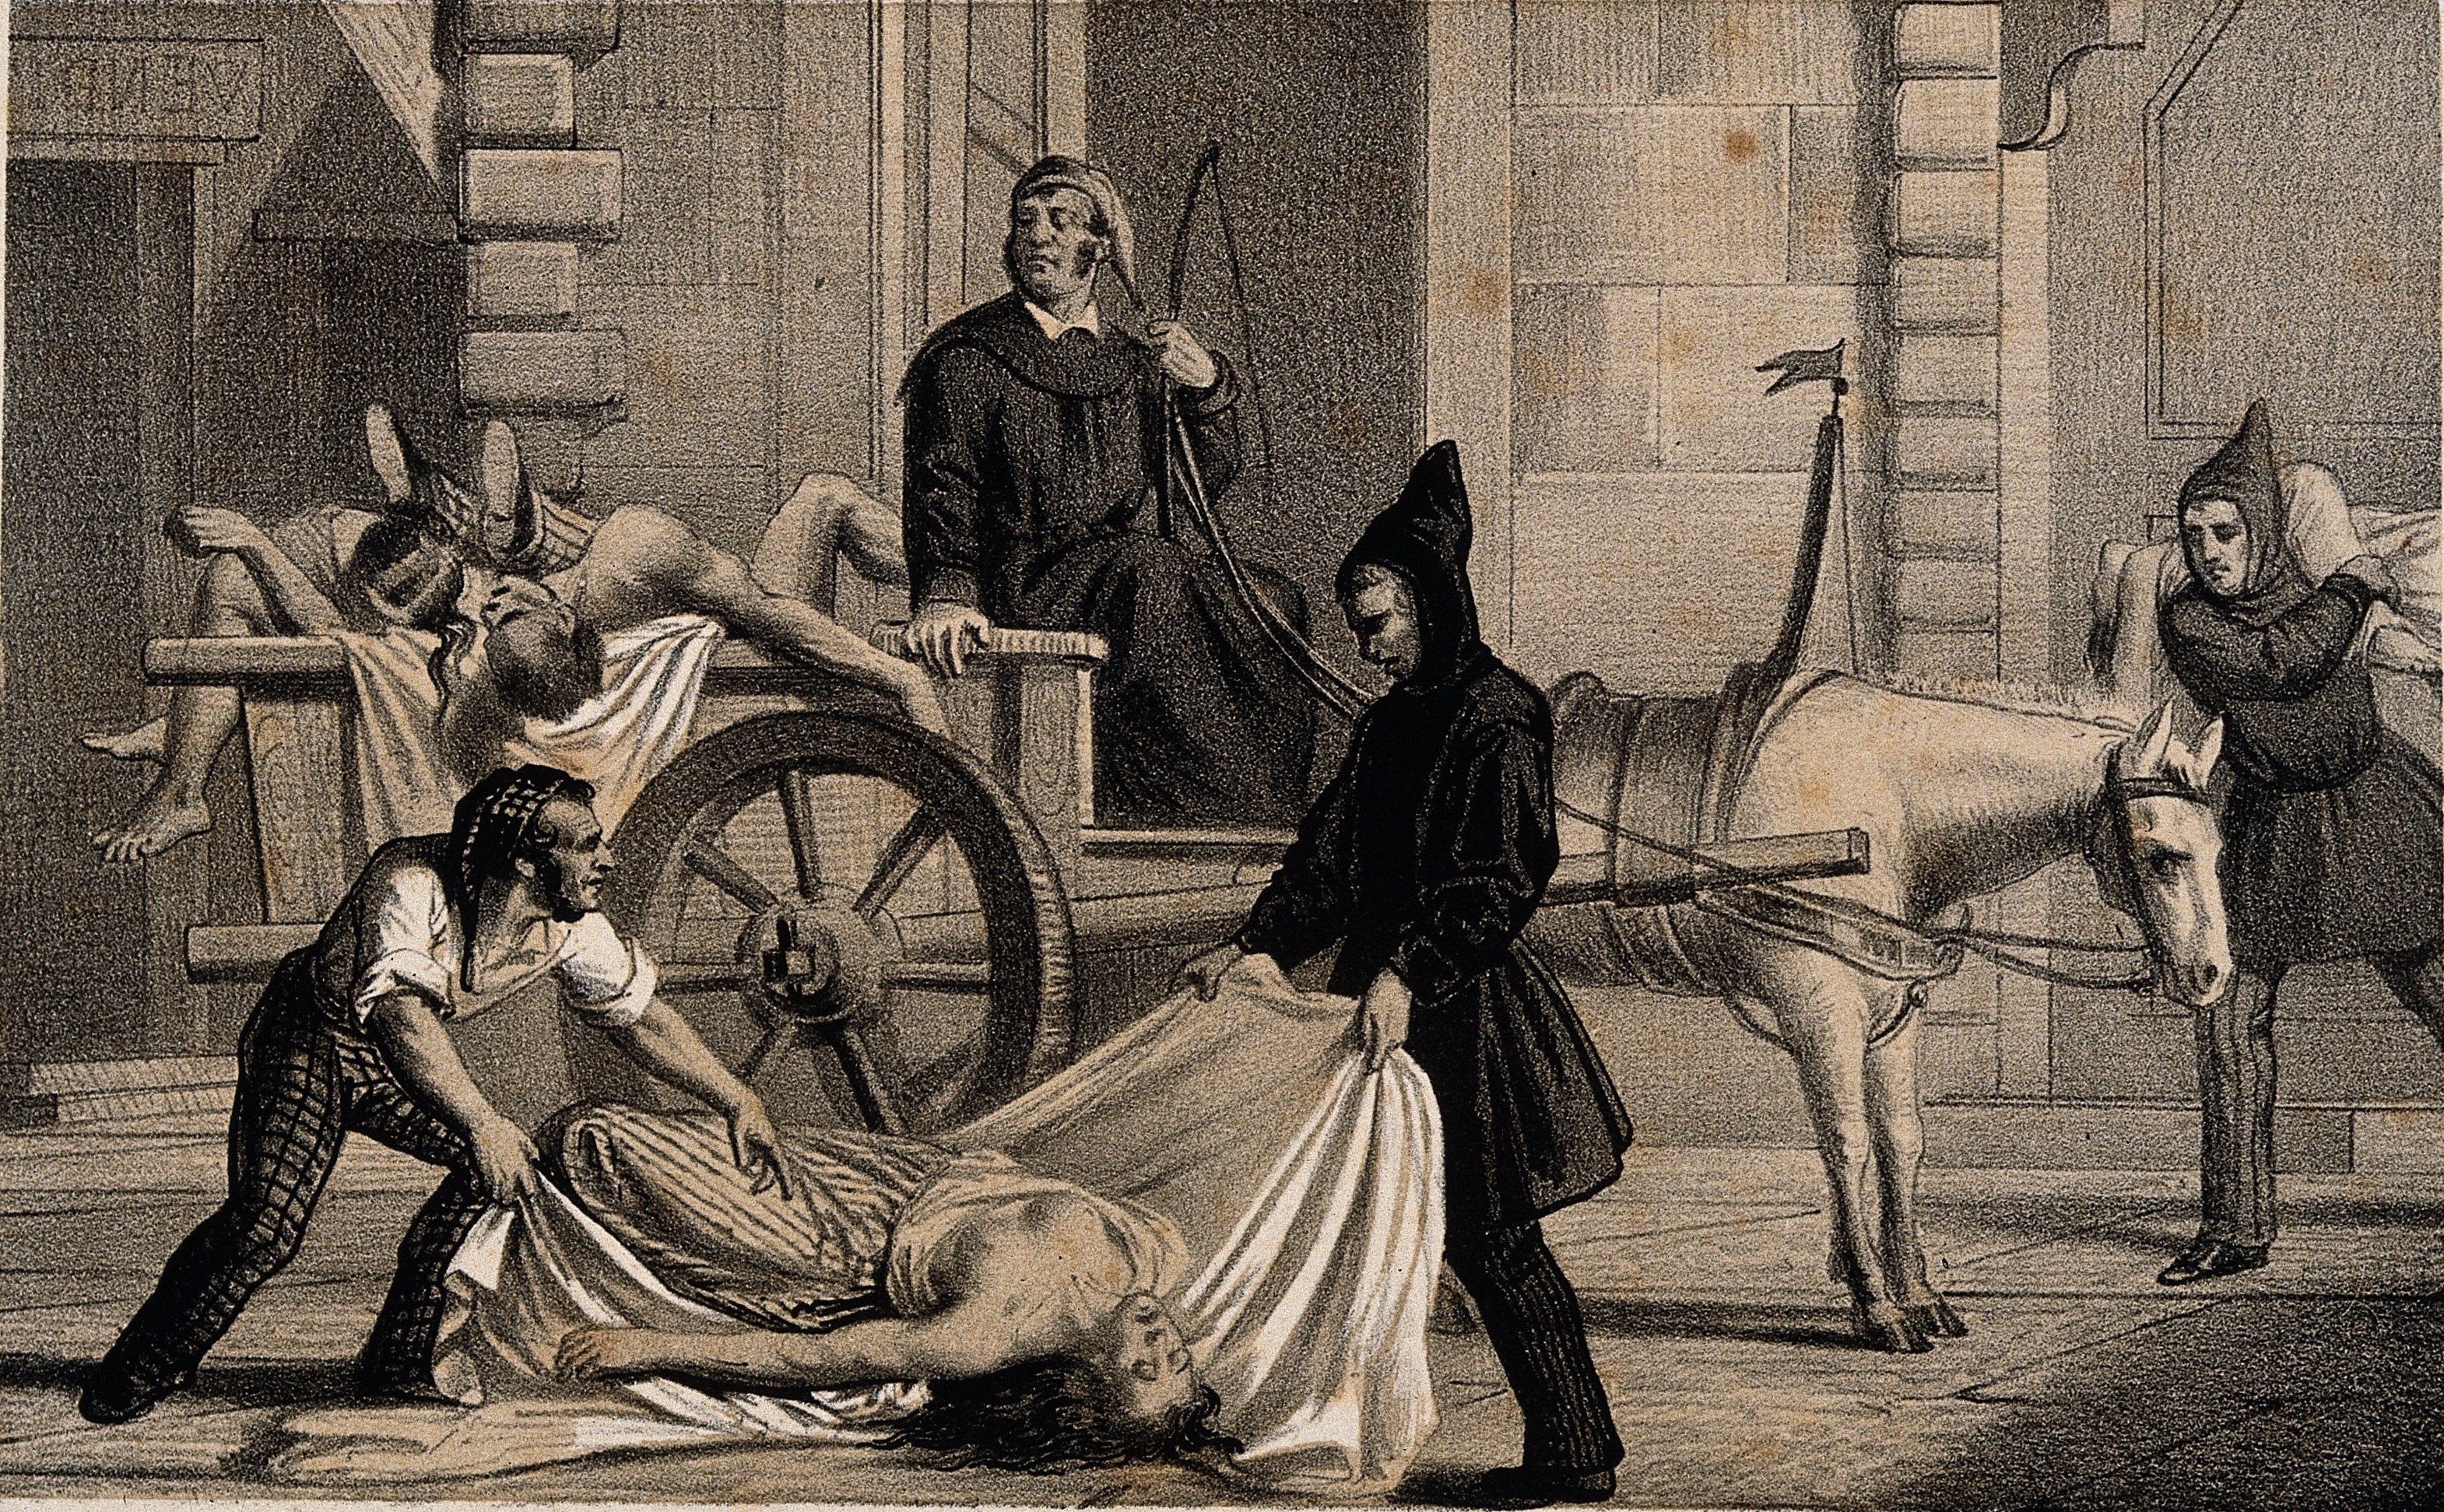
How statistics solved the Cholera transmission problem
Cholera outbreaks in the world
The mystery of Cholera's cause and transmission
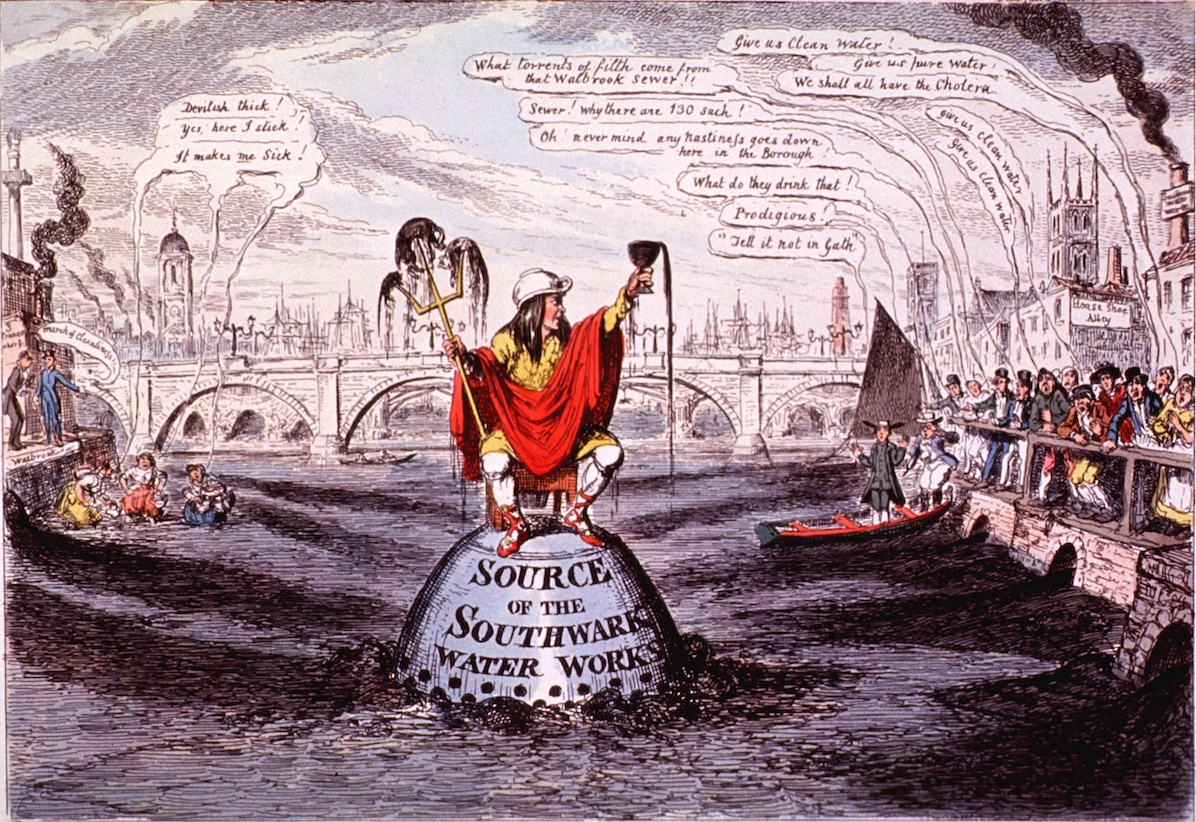
Miasma theory
The theory of indirect and airborne transmission held that cholera was caused by the smell of the bad air (miasmata), a poisonous vapor with suspended particles of decaying matter and a foul smell
- 19$^{th}$ century prevailing dogma.
- It made sense to most as disease and epidemics were concentrated in poor, filthy and foul-smelling city neighborhoods.
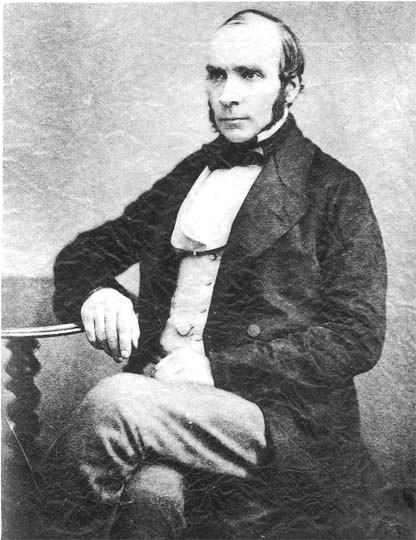
John Snow
British physician, considered one of the fathers of modern epidemiology.
He was skeptical about Cholera being caused by pollution or a noxious form of "bad air".
He proposed that cholera was attributable to a self-replicating agent, probably ingested through the medium of water. Hypothesis
.
(15 March 1813 - 16 June 1858)
Statistical hypothesis
A hypothesis is an assumption about certain characteristics of an object of interest/study. This assumption may or may not be true.
In Statistics, a hypothesis is a specific statement regarding the relationship between two variables.
- Does the association exist?
- Could it be by chance?
- Is there bias?
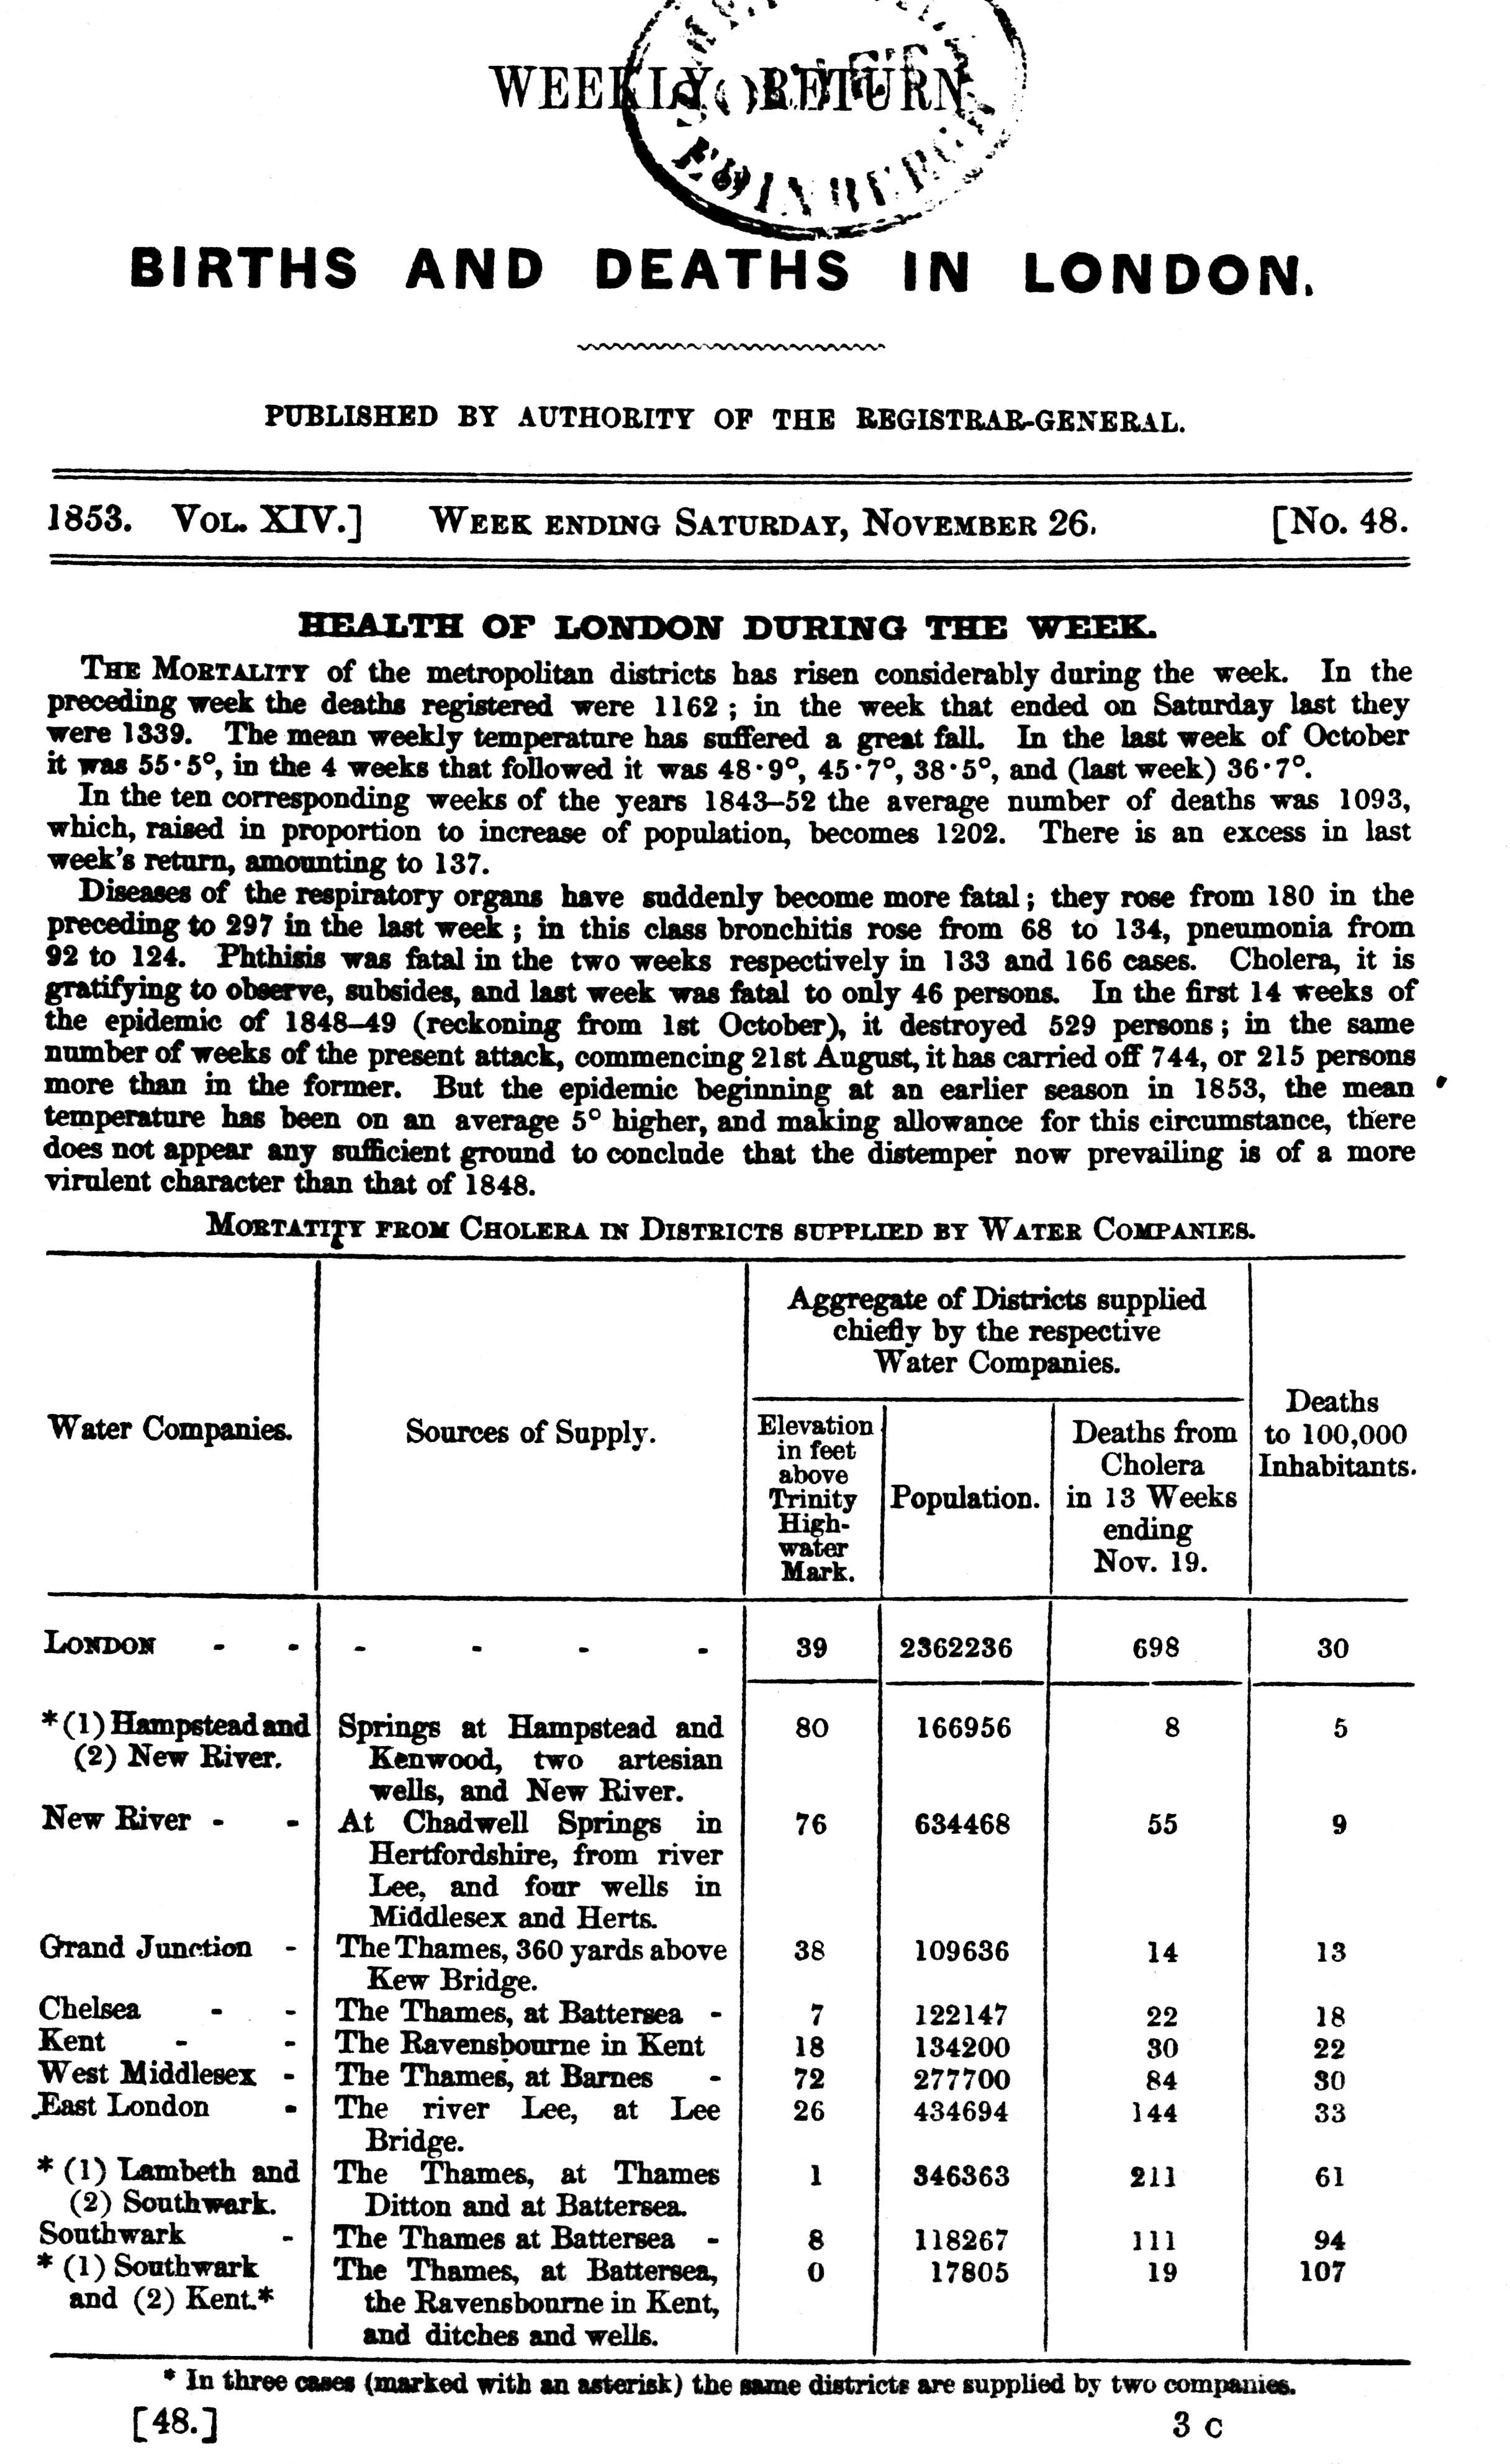
The River Thames, a (polluted) source for water companies
Soho cholera epidemics (Sept. 1854)
The most terrible outbreak of cholera which ever occurred in this kingdom. - John Snow -
The first 10 days: > 500 fatalities
John Snow's dataset
Snow tracked the numbers of cholera fatal attacks in the neighborhood.
Variables
Observational Units
House
Address
Population
Fatalities
House #1
45 Lexington St
8
5
House #2
15 Broadwick St
21
7
House #3
61 Poland St
4
1
House #4
37 Broad St
27
16
House #5
48 Carnaby St
11
3
House #6
46 Beak St
8
0
House #7
43 Broad St
44
9
Observational units & variables
An observational unit (or case) is the individual entity of interest on which data are recorded.
The recorded characteristics of the observational unit are the variables of interest. Those variables can be quantitative (numerical values) or categorical (category designation).
John Snow's dataset
Snow tracked the numbers of cholera fatal attacks in the neighborhood.
Categorical
Quantitative
Variables
Observational Units
House
Address
Population
Fatalities
House #1
45 Lexington St
8
5
House #2
15 Broadwick St
21
7
House #3
61 Poland St
4
1
House #4
37 Broad St
27
16
House #5
48 Carnaby St
11
3
House #6
46 Beak St
8
0
House #7
43 Broad St
44
9
Categorical & Quantitative variables
A categorical variable divides the observational units into groups.
A quantitative variable measures a numerical quantity for each observational unit.
Name
Year
Gender
GPA
Sibling
Height
Weight
TV
Award
Paul
Senior
M
3.1
2
71
180
3
Olympic
Nicole
Somophore
F
3.4
0
66
140
1
Nobel
Maria
Senior
F
2.9
4
64
135
0
Academy
John
First Year
M
1
68
160
2
None
Chris
Junior
M
3.8
3
72
173
1
Nobel
What are the observational units & variables?
Does louder music cause people to drink more beer?
Do males find females more attractive if they wear red?
Are lions more likely to attack after a full moon?
John Snow's dataset
House
Address
Population
Fatalities
House #1
45 Lexington St
8
5
House #2
15 Broadwick St
21
7
House #3
61 Poland St
4
1
House #4
37 Broad St
27
16
House #5
48 Carnaby St
11
3
House #6
46 Beak St
8
0
House #7
43 Broad St
44
9
Subset of the dataset.
Tracking down the outbreak's source
Snow analyzed the spatial pattern of the disease based on:
An outlier is an observed value that is notably distinct from the other values in a dataset. Usually, an outlier is much larger or much smaller than the rest of the data values.
Outliers in Snow's Soho investigation
The information given by the outliers was important: it helped Snow rule out other possible sources of the epidemic besides pump water.
A workhouse had 535 inmates but almost no cases of cholera.
=> Snow discovered the workhouse had its own well
The 70 workers of the brewery on Broad Street also escaped cholera.
=> Mr. Huggins (owner) told Snow that the men drank the liquor they made or water
from the brewery’s own well.
An elderly widow in West Hampstead (an area some distance away, which was free of cholera)
and her niece died from cholera.
=> She liked the taste of Broad Street water, and she had a bottle brought to them every day from the pump
The Broad street pump area
Area for which the Broad Street pump is the fastest trip to water (on foot).
From data to administrative action
On Sep 7, 1854, Snow took his research to the town officials and convinced them to take the handle off the pump.
Still, the scientific community was reluctant to
believe his theory
What would be alternative explanations
for the decrease in cholera fatal attacks?
Snow's "Grand Experiment"
Despite the success of Snow’s theory in stemming the cholera epidemic in Soho, public officials still thought his hypothesis was nonsense. => He needed stronger evidence.
Research question:
Is there a causal relationship between water supply and cholera?
The population is the entire collection of observational units we are interested in.
A sample is a subset of the population on which we record data.
Numerical summaries about a population are called parameters, and numerical summaries calculated from a sample are called statistics.
The London waterworks landscape
2 major water supply companies
1849 epidemics
1853-1854 epidemics
Lambeth Waterworks
London intake
Seething wells intake
Southwark Vauxhall
London intake
London intake
What are the two groups tested?
What are the different variables?
What results are we anticipating?
Experiment & Observational study
An
experiment is a study in which the researcher actively controls one or more of the explanatory variables.
An observational study is a study in which the researcher does not actively control the value of any variable but simply observes and record the values as they naturally exist.
Snow compared different exposure groups, but did not assign the exposure (contaminated water or not). What kind of study is it?
Snow's "Grand Experiment"
Despite the success of Snow’s theory in stemming the cholera epidemic in Soho, public officials still thought his hypothesis was nonsense. => He needed stronger evidence.
Research question:
Is there a causal relationship between water supply and cholera?
Observational units:
"Groups" of people
Variables:
- Occurence of cholera fatal attacks (outcome)
- Type of water supply (explains difference in outcome)
Explanatory & Response variables
A
response variable is the variable about which questions are asked, it measures the outcome of the study.
An explanatory variable is any factor that can influence, explain or predict the response variable.
The response variable is usually called dependent, while the explanatory variable is sometimes called independent.
Does meditation help reduce stress?
Does sugar consumption increase hyperactivity?
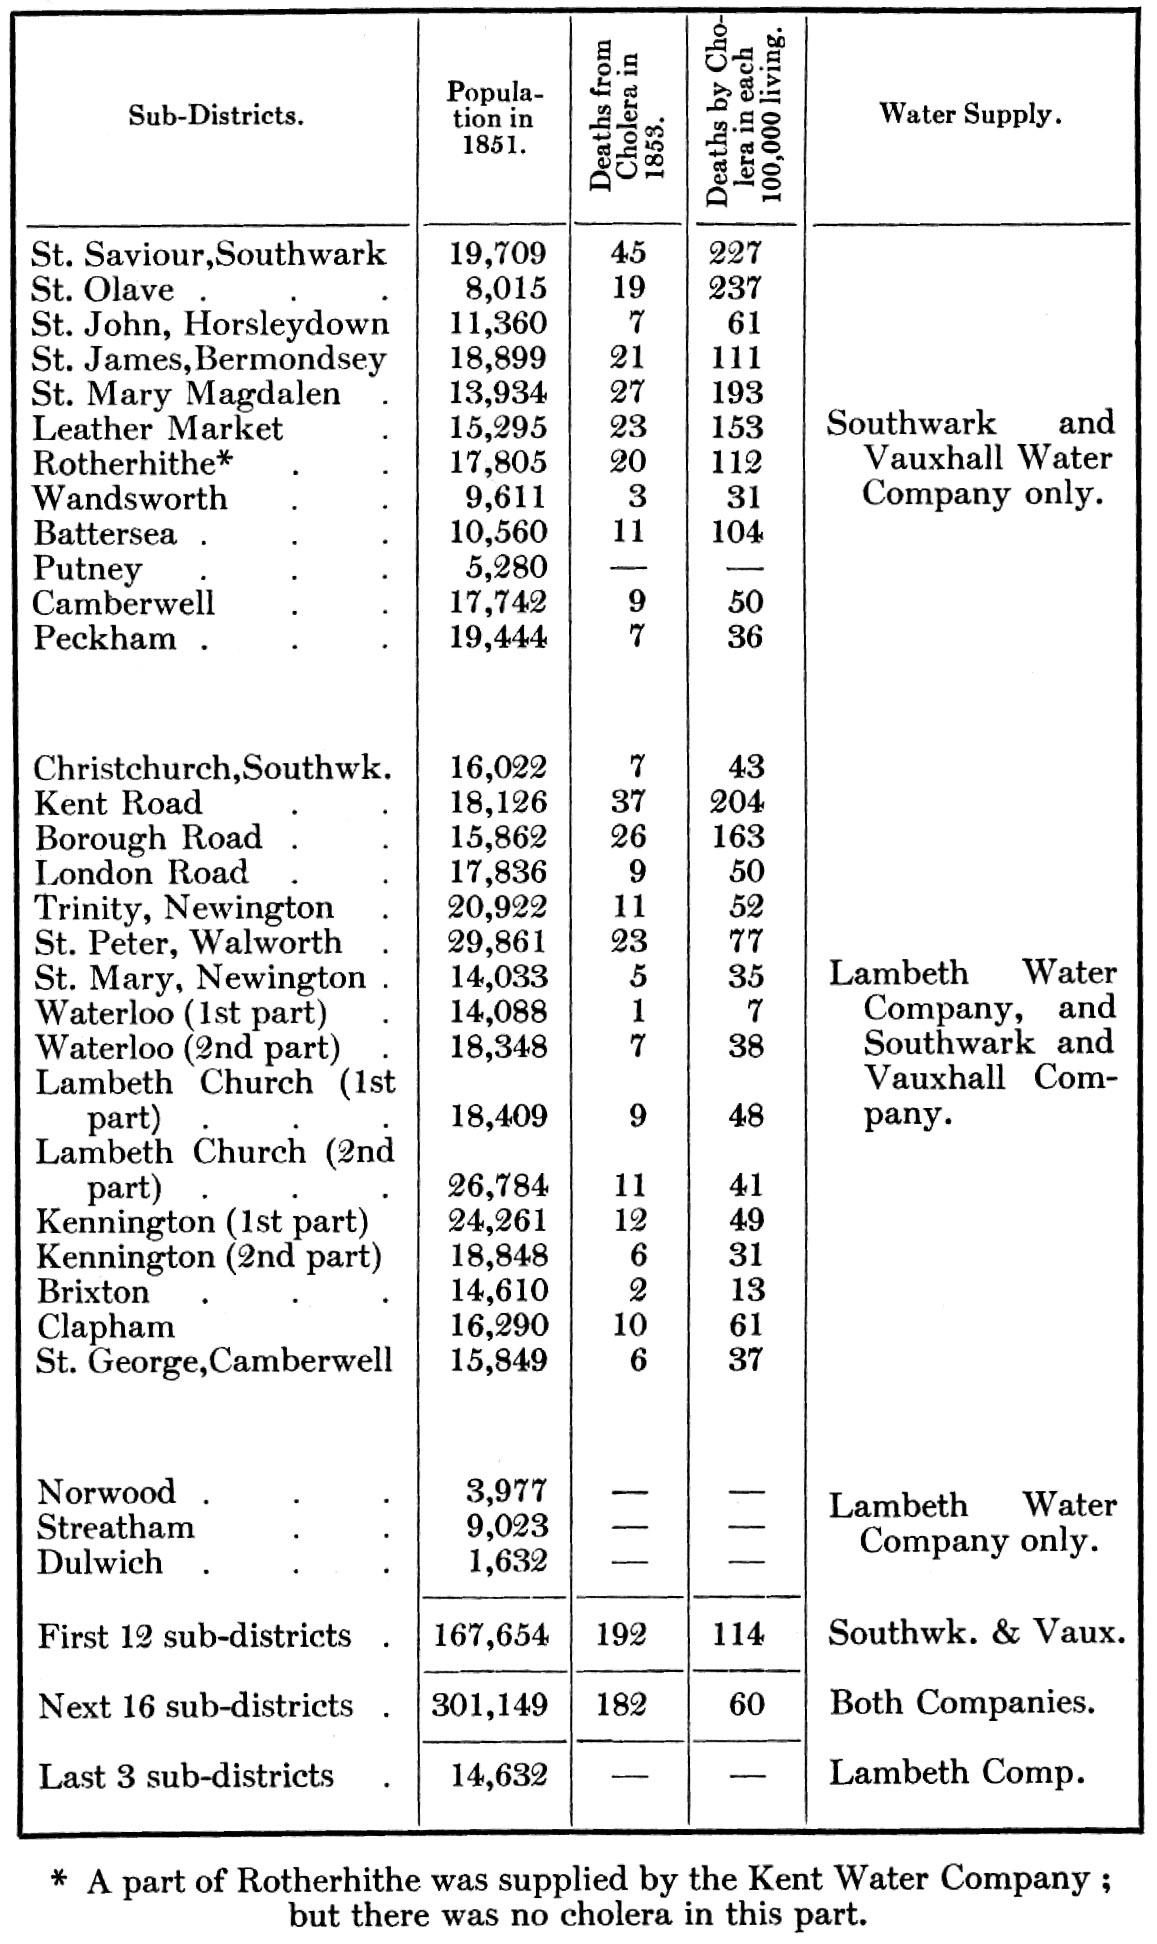
Snow's analysis of deaths data
Data
Analysis
Water supply and cholera occurence
Number of houses
Deaths from cholera
Deaths in each 10,000 houses
Southwark & Vauxhall
40,046
1,263
315
Lambeth Waterworks
26,107
98
38
Rest of London
256,423
1,422
55
8 times more likely to die
On the basis of these figures, which company is more likely to be transmitting "morbid matter" causing cholera?
Cannot tell!
(we need to normalize the data)
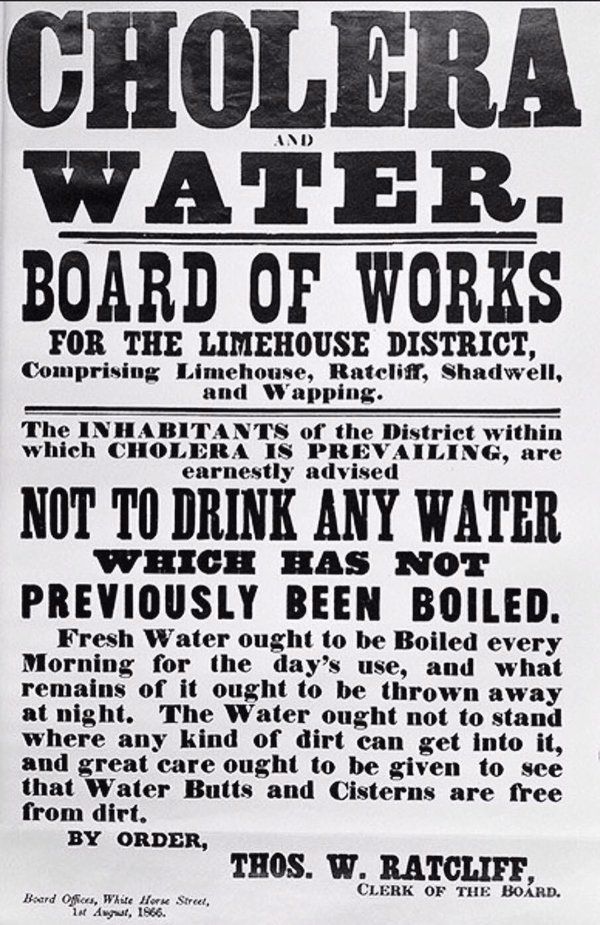
New prevention measures enforced
Less people started to question the relevance of the germ theory to cholera.
New prevention and control measures developed to prevent cholera outbreaks (boiling water)
Improving the London waterworks
The S&V company was forced by the Metropolitan Water Act to move its intake to a location far upriver near Hampton.
6 steps of a statistical investigation
Could water supplied to South London residents by private companies be a principal vector for the transmission of cholera?
Large scale study of cholera fatal attacks in South London (water supply randomly "assigned")
Looking for patterns by comparing the occurence of cholera fatal attacks in the different population groups
People served by sewage-contaminated water seem more affected
by fatal cholera attacks
Contamined water is most likely a source of cholera infection. Cholera is a waterborne disease.
Need for analyzing water samples (identify "germ").
Boiling water mandatory during cholera epidemics.
Summary
Data are everywhere.
A dataset is usually comprised of variables measured on observational units.
Variables can be
Categorical Quantitative
Response Explanatory
Data can be used to provide information about essentially anything we are interested in and want to collect data on!
Statistics is a powerful tool to draw inferences and make decisions.
Don't say that the hypothesis has been proven right or wrong, but rather say that evidence is either strong or weak.


 (15 March 1813 - 16 June 1858)